Who doesn’t want more power? Now with VeloViewer PRO✚ membership you get all the bits you already know and love but with no “refresh limits” on your Update and Rivals page….all for £20 a year! With PRO✚ there is no need to wait before you can check all of your segment placings, find any newly created segments and see how your Rivals are fairing. It also gives you the opportunity to show your extended support for the site by paying that little bit more than the standard PRO rate. NOTE: there are no changes to what is available to PRO users now or in the future as a result of this 🙂
Continue reading
Author: Ben Lowe
VeloViewer PRO – one year in!
The 9th November 2015 will mark 1 year since the introduction of VeloViewer PRO and I would like to take this opportunity to thank everyone who has upgraded to PRO and helped to support the site over this last year (and prior to that). It has been an exciting time for me personally as it has allowed me to drop 2 days a week of the day job to focus on supporting and adding features to the site which hopefully you’ve all benefitted from. I’m really excited about both improving the existing functionality and working on new areas over the next 12 months and fingers crossed the PRO membership numbers will increase and I’ll be able to do a Ray Maker and turn VeloViewer into a full-time job!
Summary View of Heart Rate Zones, Power Zones (& now Pace Zones) and General Suffering
 Viewing your heart rate, pace zone and power zone distributions (i.e. how much time spent in each zone) along with Suffer Scores for individual activities is very straightforward, but only once we see that data represented over longer periods of time do we get a clearer view of how well our training has been going. On your VeloViewer Summary page each of these metrics can now be viewed with the distributions clearly displayed with the data grouped over whichever time period you need.
Etape du Tour 2016 – Megève to Morzine
 The Etape du Tour is justifiably up there as one of the most prestigious sportives in the world, taking in a stage of the Tour de France just a few days before the race tackles the same roads. The 2015 route was 138km with 4,400m of climbing but the 2016 route, despite being slightly longer at 146km, looks to have a fair bit less climbing at around 3,500m. But it isn’t all good news, the fearsome Col de Joux Plane, often touted as the hardest of the main cols in the Alps, is saved till the end with just the roller-coaster descent to Morzine to follow. More details on the four climbs of the day below.
Comparison of Strava Estimated Power to Power Meter Values
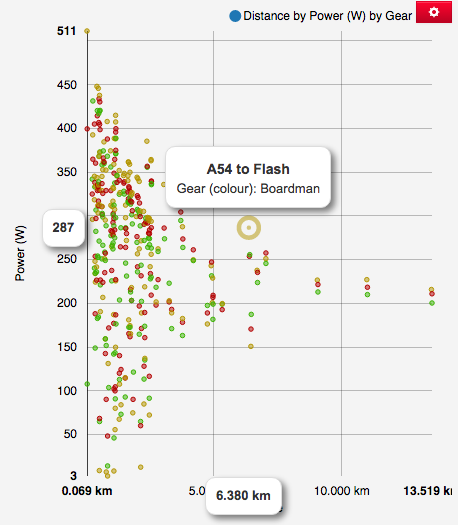 Recently I heard a question on the excellent DC Rainmaker/TRS Triathlon podcast asking how realistic the Strava estimated powers are compared to those recorded by power meters. A bit of GPX hacking later and now we can check out a comparison using the new efforts page in VeloViewer.
Monsal Hill Climb 2015
 Over recent years Monsal Hill Climb has become one of the cornerstones of the increasingly popular British hill climb calendar and in 2015 I was very proud to be able to help support the event via VeloViewer as well as compete for the 4th year running, this time alongside 6 others riding for team VV. Here are some pictures of the event that, once again, was the welcome recipient of some amazing weather. The event was won by Joe Clark and Lou Bates with Adam Kenway & Jack Pullar and Jessie Walker & Dame Sarah Storey completing the podiums.
The Climbs of the Aviva Tour of Britain 2015
The Aviva Tour of Britain has established itself as the main alternative preparation race for the World Championships (the other being the Vuelta a España). The parcours is tough and often ridden very hard with the domestic teams wanting to show their pedigree whilst the top WorldTour riders looking to get some hard day’s racing in the legs to help rebuild their form. Team Sky always want to fare well being the teams, main, home race but the top tip could well be ORICA GreenEDGE’s Yates brothers looking to take control of the race on their home roads of stage 2. Here are more details of all of the climbs from each stage. Interactive profiles and full stats available on the climbs page.
Getting and Sharing 3D Profile Images
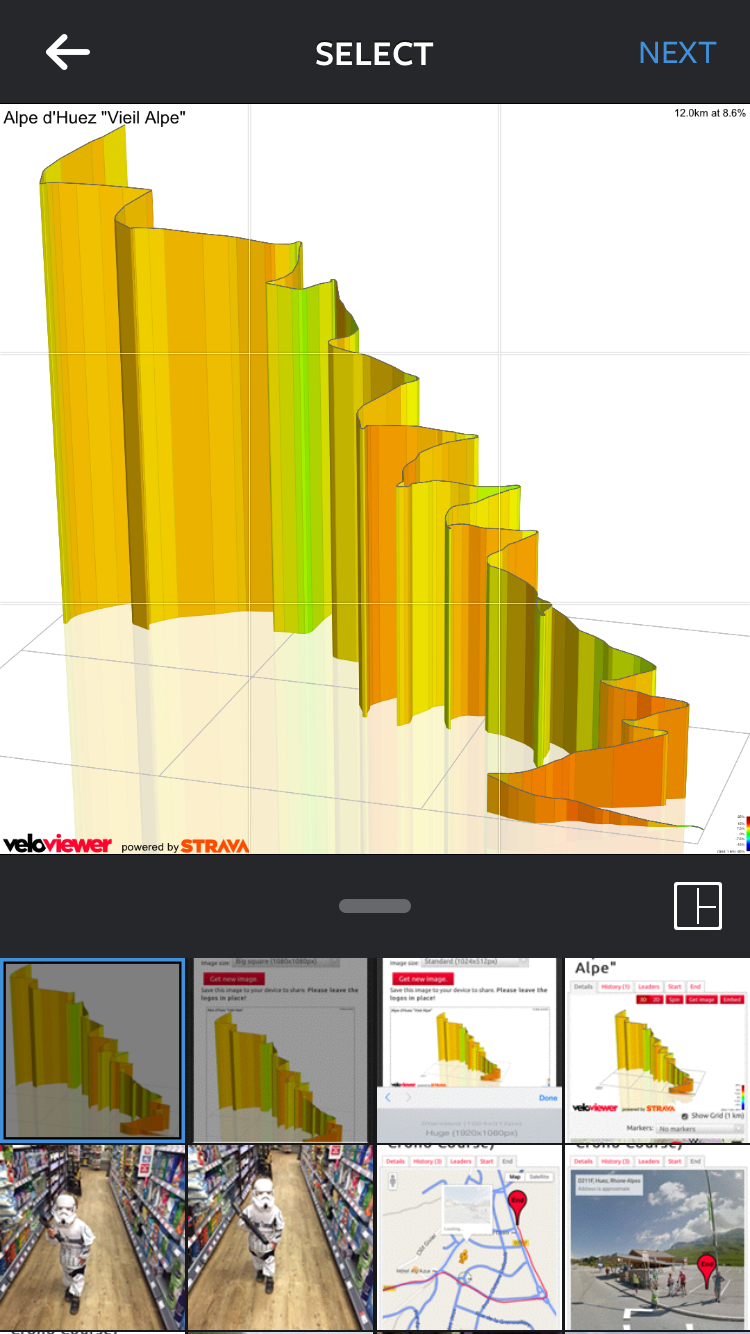 Hopefully lots of you will have seen the 3D profile images being showcased on Eurosport throughout the Tour de France coverage this year. I have now massively improved the way you can get hold of your own 3D profile images of rides, runs or segments to make it much easier for you (as well as me) to attach to your Strava activities or share on social media from your phone, tablet or PC/Mac.
Key Climbs of the 2015 Tour de France
 The 2015 Tour de France is set to be one for the climbers (if they all make it through the cobbles) with 12 stages finishing at the top of a hill of some kind and a few more testing mountain stages with descending finishes. The early, classics style climbs will certainly make the initial competition for the yellow jersey more exciting with the puncheurs looking to take the lead, but the main GC battle will be decided on the classic climbs of the Pyrenese and Alps. Checkout some of the key climbs of the race below.
Critérium du Dauphiné 2015 Stage 7 Preview
 The Critérium du Dauphiné is always one of my favourite races of the year, primarily for the awesome scenery of the high mountains and this year is set to deliver again. Stage 7 is undoubtably the Queen Stage heading from Montmélian to the ski station at Le Bettex perched above the idyllic mountain town of Saint-Gervais. Five 1st category climbs stand between the two towns with the last two basically making up one HC climb with a short and potentially tricky descent thrown in to disrupt the rhythm. I was “lucky” enough to test out those final two climbs for myself and noticed my Garmin reading as much as 20% gradient!