 The VeloViewer Score is a composite measure providing a single value that represents your best Strava achievements. This value can then be used to benchmark yourself against any other VeloViewer user around the world. In this post I’ll explain how it is calculated and where your Score fits in against other VeloViewer users.
The Calculation
The VeloViewer Score is the average Position Score of your top 25% of your non-descending, scoring segments maxing out at 100 segments. A Score close to 100 is good, close to 0 is bad!
Segment Position Score… eh?
Your segment Position Scores have been in in VeloViewer for quite some time now and provide a value that represents your relative position to the other riders on each segment. This is using the exact same scale as the VeloViewer Score so close to 100 is good, close to 0 is bad. The formula used to work out this score is:
Position Score = ( [K/QOM Athlete Count] + 1 – [Your Position] ) * 100 / ( [K/QOM Athlete Count] + 1 )
Because we add 1 to both of the athlete counts in the equation it is impossible to actually get a value of 0 or 100, this is because not all KOM’s are worth the same. If you are in 1st position on a leaderboard then your score will vary depending on the number of athletes: 50 when you are the only person to have completed the segment as you are actually equally in last place as well as first. The same applies at the other end of the leaderboard, being last of 3 people isn’t as bad as being last of 1000. Here are a few example scores:
| Athlete Count | Position | Score |
|---|---|---|
| 1 | 1 | 50.00 |
| 10 | 1 | 90.91 |
| 100 | 1 | 99.01 |
| 1,000 | 1 | 99.90 |
| 10,000 | 1 | 99.99 |
| 5 | 5 | 16.67 |
| 50 | 5 | 90.20 |
| 500 | 5 | 99.00 |
| 5,000 | 5 | 99.90 |
| 100 | 100 | 0.99 |
| 1,000 | 100 | 90.01 |
| 10,000 | 100 | 99.00 |
Note: being 1st out of 100 gives the same score as being 100th out of 10,000.
Why use only 25% of my segments (up to 100)?
I don’t take into account all of your segments as I just want to use the scores from segments where you’ve actually had a proper dig at getting a good time. This also lets you focus on the segments that suit your strengths as well. e.g. if you’re a Rouleur then just target those flat segments and your slow climbing times don’t affect your Score.
Non-descending only?
To stay on the right side of the Strava API usage policy I’m going to steer clear of encouraging competition on descending segments. Strava already take a small step in this direction on their own site by only allowing the setting of goals on a segment if the average grade is greater than -0.25%. I’m using that same criteria to limit the segments taken into account for the Score.
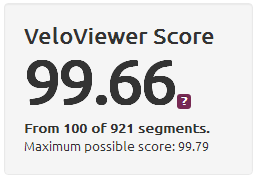
You’ll see just below the score something along the lines of “From 100 of 921 segments.” These are the two numbers determined by the above two factors.
How does my Score stack up against others?

UPDATE 21st Nov 2013: Just rechecked the distribution chart with my current data (21,679 athletes) and the result is remarkably similar to look at to that above. The updated, key stats are as follows:
- Lower Quartile – 74.60
- Median – 85.46
- Upper Quartile – 93.81
Here is a frequency distribution chart for each Score (rounded to nearest whole number). It is clearly very top heavy as the Score is weighted towards people’s top scoring segments. The average (median) is the shown by the red line and the inter-quartile range is also shown by the white area. This should give you a good idea of where you sit in the grand scheme of things but for those not up on their stats speak:
If your score falls:
- in the left grey area (below 76.8) then I’m afraid you are in the bottom 25% of VeloViewer athletes. Move direct to “How do I improve my score?” section below, do not pass go, no not collect £200.
- in the white area to the left of the red line (above 76.8 but below 87.6) then your score is in the range of 25-50% of VeloViewer athletes. Pretty good going but still some ground to make up. Maybe time to upgrade your wheels?
- in the white area to the right of the red line (above 87.6 but below 94.5) then your score is in the range of 50-75% of VeloViewer athletes. Proof that you are better than average even if it is in something fairly meaningless!
- In the right grey area (above 94.5). You can direct your partner to this graph as scientific proof as to why spending that excessive portion of the kid’s inheritance on those ridiculous looking/sounding aero wheels was justified. Congratulations! (note: if anyone wants to give me a set of those ridiculous aero wheels I’d happily take them and blog about how much faster they make me go.)
How can I see what segments make up my score?
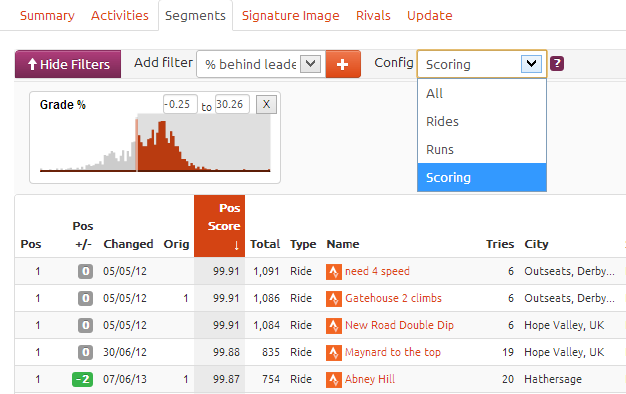
Go to your Segments list and pick the “Scoring” option from the “Config” drop down. A filter will be applied removing your downhill segments and the data will be ordered by the position score. Make sure you remember how many segments your Score is being made up of (in my case it is 100). The top 100 (or less if that is the case for you) segments will be the ones making up your VeloViewer Score.
How do I improve my score?
Go faster more of the time? Does that help? A couple of slightly more practical tips might be:
- Go to the “Scoring” config for your segments but then reorder by the “Total” column (total number of athletes). The segments at the top of your list will be the ones that have the greatest potential position score. Now filter these segments to pick the ones most suited to you (e.g. long climbs, short climbs, long flat sections etc.) and look to see which have the best opportunity for you to increase your current placing using something like the “Behind leader %” value.
- The other way would be to find segments with lots of athletes that you haven’t actually ridden yet. For the time being you’ll have to do that on Strava’s Segment Explorer.
What’s not so great about the VeloViewer Score…
Like all things, nothing’s perfect, and the VeloViewer Score has a number of limitations which is why it should be used as a tool to rib your mates that you are beating but not something to lose any sleep over. The issues that stand out for me are:
- Duplicate segments – as you can see in the screenshot above showing the segment list filtering, my top 3 scoring segments used in the Score are just about all the same bit of road. I could go and hide 2 of them in Strava but then down goes my Score (and my KOM count!) If I was a real knob I could create a couple more duplicates here and give my Score a boost! Don’t do that, unless you really are a knob.
- Limits to individual position scores due to low athlete counts – even if my wife was QOM on all of her segments her Score would be lower than mine despite a large number of my scoring segments not being KOM’s, this is because each segment’s position score is limited by the number of athletes and round these parts there just aren’t that many women Strava’ing their rides.
- Now that I’ve plotted out the distribution of Scores it is obvious it isn’t very normalised having a distinct lean towards the higher Scores. What this means is that where the highest number of athletes are scoring, the distinction between their Scores can probably get lost. Potentially I could attempt to apply some kind of multiplier to everyone’s Score in an attempt to normalise the distribution but I’m not sure how well that will go down with people! It might be worth playing around with if only from a “isn’t maths fun” perspective. If anyone knows how I would go about doing this then please let me know 🙂
Jessica Hamilton says:
Sounds like you need to use a logarithmic scale in part of the calculation. From the table that you’ve shown, it is very clear that the calculations are extremely skewed towards values >= 90. The examples of 100/1000 and 100/10000 seem overly optimistic.
Here in NZ, even on possibly the biggest cycling event in the country, on Strava, my top total athletes segment is 658.
There are a much greater number of average athletes than there are extraordinary athletes, but your calculations give the inverse.
Also, I don’t know how the positions for segments work in the API for ties, so it’s hard to comment on that, but I imagine on segments with a huge number of athletes, I’d suspect there’d be a significant number of ties for the stronger athletes which would presumably keep the top 100 or so a lot closer together.
Perhaps an alternative method would be to base the score on relative times, rather than absolute positions. So your score would be based on the ratio of your time behind K/QOM to the slowest time. This should at least give a more even distribution curve. And then you could probably use something similar to the current VeloViewer score scaling for segments with a small number of athletes (or just the one)…
Wesley van den Berg says:
I’m not sure if its the calculations, per se, that cause the skewed results, its just that you filter the highest 25% / 100 segments out. This combined with the probability that the most competitive users will find their way to VeloViewer will create skewed data… Especially the first reason has its purpose.Therefore, I’m not sure if its a bad thing that the data is skewed.
The problem Ben points out about the distinction getting lost is there however and I’m not sure if the cutoff is correct. In general I’d consider myself within the top 10% of the game of Strava, but as I have about 70 segments I can do very often I’ve had some good days on these segments. This means that my score is 98.75 (From 100 of 555 segments Maximum possible score: 99.69), which is too high in my opinion for my status as rider.
Even though it would really hurt my score I’d say that the lowest 25%, or maybe only segments in the lowest 25% with more than 5 tries (?), should be excluded and for the rest we should just work harder to get the score up. Automatically this will unskew the data a bit (though, as it still only takes the PRs of people finding their way to VeloViewer it will be skewed) and will make it harder to get to the top scores where distinction gets lost…
But maybe I’m just babbling, who can tell 🙂
Ben says:
I think that the individual segment position scores should be left alone as they provide your PR’s relative position to everyone else’s PR’s. How many times you or anyone else has ridden it doesn’t really come into it.
What we can do is play around with how the overall Score is put together but the more complicated that becomes the less people will understand what it represents.
In response to Jessica and lukwe, when I first put together the segment position score the idea of using times rather than position was suggested but that would require knowing what everyone’s times are on all of the segments which is just infeasible. You’d also get those outliers where people stopped for a mechanical/cafe/etc mid segment or just lots of people not trying that would skew that result.
I think, as Wesley suggests, it will be worth looking into increasing the amount of segments taken into account in order to allow those people who go all out to get the best times on all segments to get better scores than those of us that only make the effort on a few. It is just the matter of finding the right balance that lets people have the opportunity to improve their score but not to discourage people from riding new areas at a sociable pace because that might cause their score to drop. I’d rather use VeloViewer to encourage people to ride different routes rather than encourage them to stick to the same segments all the time.
I could look into extending it out to be the top 33% of segments without the 100 limit. What do you think? Any more than that and it will have a massive impact on those of us that do most of our riding with a club and only attack segments properly on rare occasions.
What would be nice to build on top of that would be to try and find a way to provide an accompanying score that reflects how much of an explorer you are rather than someone who rides the same routes all the time. I’ve got some ideas on this but no idea if it will scale very well.
I’ve tried out applying an exponential to the Score calculation and it certainly spreads out that spike. Potentially a mix of increasing the segments and applying this shift might give a better distribution while still keeping the Score useful for the majority of users.
Wesley Van den Berg says:
From what I’ve read I guess it depends on what people actually want from the score. For me I just want to have an idea of how I stack up in general so everything I’ve done at tempo (so without stops and recovery trainings), I have a feeling others only want to see segments they went all out on. I don’t think the 100 limit isn’t really needed and maybe the percentage could be a variable for people to choose? (Maybe with buttons for 20% 40% 60%?)
James G says:
I think 33% is a good choice. The lower it is, the more likely club riders can skew their results for the better by chainganging to the top of the leaderboards. I agree one should be rewarded for getting out there and trying on loads of different segments rather than just going all out on a small proportion.
If you did use an exponential method you may have to also enforce a minimum number of users on a segment – otherwise couldn’t you attack segments with very few people and skew your results (which can’t currently happen).
Have you thought of doing a VV Score leaderboard or is that against the T&C?
Wesley Van den Berg says:
Not mucht too add, but VV Score leaderboard sounds like a great idea… also delivers that little bit of extra inventive to keep improving a score close to the max
Ben says:
The exponential would only be applied on the combined score so all of the segment position scores that feed into it will remain unchanged. Basically the exponential is just used to spread out the scores a bit to try and normalise the distribution. Your position compared to everyone else in a score leaderboard (if there was to be such a thing) would remain the same.
I have always thought that I should exclude short segments (this could be based on distance or better still on kom elapsed time) as your margin for error from the gps/segment matching algorithm can make such a big difference to your placing, for the better or worse. Also, I think, which device you use (phone vs dedicated GPS) can influence it a bit too. I can imagine that could be a controversial idea!
Ben says:
I definitely want to have a single Score as I’ve seen people comparing them on various forums, if there are choices in that score (like those % options) then it gets too confusing and you can’t compare them properly any more outside of VeloViewer.
Really appreciating all the feedback. I don’t think there is a single way of doing it that isn’t subject to numerous distortions. Duplicate segments and people hanging on the back of a fast moving bunch being the biggest 2 I can think of.
lukwe says:
have you tried a trivial log() of your current formula to space out things a bit ?!?
otherwise try something like
segment_score = ( SUM( time % above people ranking lower ) – SUM ( time % behind people ranking higher ) )
.. if it doesn’t blow computationally
the real problem remains duplicate and partially overlapping segments !!!
would it be possible to recognize them and choose just one in your scoring computations?!?!
ciao
Ben says:
I’ve been messing round with applying a double exponential to the score and that seems to spread things out quite nicely. We’ll see how the 25% / 100 segments debate goes first as if those values change then I might need to tweak the formula again.
If you’ve any ideas how I could easily recognise duplicated segments and which ones I should not consider then I’m all ears! The only thing I can think of is when you look at the segments from an activity perspective as you know all their start times and elapsed times so you’ll know how many overlapped. But how do you know which to exclude and which to keep?
luca p says:
I would keep the older one, since its leaderboard will be more populated and significant;
I also believe you should leave anything below 150m in length out, just like the ‘non-descending’ thing already implemented.
Lukwe (cannot login to Disqus tonight!?!)
Ben says:
I’ve just mentioned my desire to exclude short segments in a reply above. I’d ideally do it on the KOM elapsed time as a 25% grade climb over 149m is a pretty tough segment!
Jessica Hamilton says:
How short is short? Most of my top scoring segments are short, as I love sprinting… also, I saw somewhere in the comments about selecting segments ordered by date. I think that’s a good idea, as if you want to have something to ‘brag’ about or compare, surely it should be of your current ability?
badger says:
The biggest problem with short segments is bad matching, I have several where I’m not the KOM only because another rider has matched the segment with an actual distance 30-50m shorter – on one this reduces my score from 99.2 to 97.7 🙁
However a lot of my high scoring segments are short flat sprints, so I wouldn’t want them to be excluded. I’d be happy for anything less than 150m and/or less than 15s to be gone though.
As for transforming the score to give better separation for those at the top, I suggest using something like the following:
Score = -100*ln(1-[average vv score/100] )
examples:
99.99545 1000
99.9 691
99.7 581
99.2 483
98.9 451
98.5 420
97 351
95 300
90 230
85 190
80 161
75 139
70 120
So going from 70 to 90 is about the same points as from 90 to 97 and about the same as going from 97 to 98.9
I was also thinking it might be worth also considering the possible score, for those in areas that aren’t strava’d much – not sure how this could be done though.
badger says:
While I’m thinking about it, expanding the number of segments for people who had ridden a lot is a good idea. Of my 100 scoring segments, I have a big effort in about 80 (KOM in 34, top 3 in 51, top 10 in 62). I’ll be running out of segments to improve soon. However I have 677 possible scoring segments, so 25% of that would be 169 segments. Using all 169 would reduce my current score from 95.16 to 87.31, but give me more room to improve in the future. It also gives a better indicator of my overall performance.
Konrad Kowara says:
“Check placings” button on the update section can lead to a pretty
dissapointing result when used, especialy if not used very often. On the other
hand, it shows that there are quite significant opportunities for skewing the
results, as the data needs to be pulled on user request, rather than updated
live. How about an automatic update of all placing on segments >1month old when doing the new activities
update? Just a suggestion, not sure how much additional stress would it put on your
bandwidth.
And yes, it’s the most competitive Strava users who find
their way to Veloviewer, so maybe next to the Score you could show a percentile
calculated only from the Veloviewer athletes? I.e. if current median score is
87.6 then all people with it would be at 50th percentile. This could
help to put things in perspective.
Ben says:
I can’t really force the “Check Places” as it can take a few minutes to run so could easily be stopped. One of the main features of VeloViewer is for people to see their actual places, if they aren’t dong that then they probably aren’t too fussed about things like the Score.
I think potentially changing the max number of segments used might put it into better perspective. See the responses to the other comments.
Ben says:
ok, ok. I’ll have a look at combining all the checks into a single button press.
Dan says:
I think this score is calculated in a similar fashion to VCE/HSC/ATAR scores (Aussies will know what I mean).
Thanks for all your development work on this – it makes both riding and procrastinating and plotting ways to steal KOMs on the internet more interesting!
John Bytheway says:
Just as a counter balance to the “increase the top 25%” figure, looking at my numbers i have 190 segments 47 of which count, of those 47 segments i have only “hit the pain bank” on 27 of them, that makes my fast rides a meagre 14% of my overall count.
As veloviewer is as others have said more used by the more serious riders the scores will be skewed and that should be accepted and worked around.
Personally i would find any change to the scoring system that includes even more rides that i or others dont push on make the score pointless…if a rider is not pushing on the segment then their time is irrelevant to their score so i would argue that the % should actually be reduced to ensure that most riders hardest ridden only segments count giving a more valid personal score.
I agree with the person below who said updating position scores should be part of the system as your score is so dependant on your positions if your vw score is based on old position scores then the score is wrong and any comparison is pointless, perhaps your score should be only calculated when you update your positions and the date you last updated should be written under your score.
It would be nice if you could also put that your score puts you in the top X % of vw scores just to put it into some kind of perspective.
Perhaps you should have 2 scores, one using the top 15% for competitive types and another score based on your best 25-75% scores for those that do many club runs and dont “hit the pain bank” on just a few segments but just ride strong on many.
Ben says:
I’ll make sure to put any changes to the vote before doing anything so really good to get these different opinions on how it should work. The 25% and 100 segments were numbers plucked out of the air when I first implemented without any idea what the end result was going to be so now that we’ve got a fair amount of Scores in place we can work out what is best for the entire user base. I’m sure however it is done will result in some people that think it should favour one end or the other of the spectrum more, it’s just finding the right balance and trying to encourage people to get out and ride their bikes a bit more.
I’ve run a few quick queries to find out what kind of numbers the average VeloViewer user has in terms of segments and from the 9000 people who are now on VeloViewer V3 the average (mean) number of segments covered is around 580, the max is 6772 and the minimum is 1! The average number of non-descending segments is around 450.
The average number of activities is 222 with a maximum of 3487 and a minimum once again of 1.
So I’ve got to try and optimise the site (and the Score) for the majority while hopefully encouraging those below that marker (in terms of Strava activity rather than performance) to ride and Strava more whilst also keeping those extreme Strava users happy.
Reaching that 100 segment cut off for your Score should be a good goal for people that haven’t Strava’ed very much as from then on they should be able to improve the score that bit easier. Having it at 25% lets you reach that 100 segment cut off that bit quicker. I certainly don’t want to reduce the 100 segment count as then the long-time Strava users just won’t have many opportunities to improve their score at all if they are KOM on lots of segments.
Good to keep the debate going on here though and encourage others to voice their thoughts.
John Bytheway says:
Ben, clearly from the tone of your’s and others comments the vw score is going to be more of a general ability score, having read your comments last night and weirdly/sadly 🙂 thinking about it since then i can see no other way than to have 2 separate scores, your vw score for your general ability and “hopefully” a performance score for those that want to simply see how our best performances roughly compare…there is no way to make your general score work for those that are only interested in outright performance.
Certainly from your interesting site stats i am in the minority, my riding is 90% commuter based with only additional routes added through the summer sunny Sundays, therefore my 190 segments only ever increase if i do a sportive etc which is rare and if i did i doubt very much that any segments would be flat out therefore any additional segments gained would decrease my score.
I find it interesting that of your 9000 (very impressive) members the average non downhill segment count is 450, using your 25%100 rule that means you are still expecting the vast majority of your membership to have hit the pain bank for at least 100 of their segments….very impressive if they do that i struggle to do that for 27!
2 scores give you the ability to fine tune each for their intended purpose without constantly trying to appease the extremes…..and frankly make both far more useful!
Ben says:
The tone (and brevity) of any of my comments is mostly due to attempting to squeeze in a tiny bit of VeloViewer work late at night when I’d rather be in bed and around dealing with a 9 month old baby so apologies for however it might sound.
I based the 25% and 100 purely on my own data (1,315 segments, 930 non-descending), it was only when writing your reply last night did I run the queries to see what the averages are for everyone.
So how would you calculate your “best performances” in a way that can be compared?
John Bytheway says:
Sorry Ben by “tone” i meant the apparent general consensus of all the posts not anything er untoward…if you get my meaning. …lol i have a 3 year old…never gets any better.
Interesting that you based your 25%/100 on having 930 n/d segments when the actual membership average is 450….so now knowing your numbers are almost double the average would you still consider 25%100 reasonable?
For a purely performance score i would say 15%/50 would be a lot better, even for riders that do considerably more segments than i do i would think the number of segments where they really hit that pain bank is only going to be a small number and as a purely performance score you want to make sure that most if not all the segments counted are flat out, it also restricts the number of segments you have to maintain or improve your position on to keep your score when others knock you off your position.
Of course comparing scores is never going to be foolproof, i know of some local riders that do what you mention above ie getting a train to launch them at the very last moment to get the kom, you cant do anything to remove these guys and they are only kidding themselves, but it is still interesting to have some kind of number to relate to that you can try and improve.
The more i thought about having 2 numbers the more i think it would also show better what type of rider members are, whether they are a good club (lots of miles/segments) rider with a high VW score, just a fast rider with a high performance score or a strong all rounder with both being high scores.
PS i dont know how you do all this by yourself part time..and still do a better job than strava!
Alun Houston says:
An interesting discussion, to which I thought I’d add my tuppence worth.
I’m currently in the zone where every time I add new segments I have to improve a couple to maintain or improve my veloviewer score, which is a good motivator to ride more often and harder. I’d like this zone to continue past 400 segments to keep that driver to have to go harder to improve the score, so I tend towards the scrapping the 100 limit camp on that one.
With regard to the 25% rule, I understand the desire to keep things simple and this seems a fair compromise; however I personally feel that it would be improved by having 2 different scores. The first, the standard score, taking into account maybe 50% of your segments so that there’s more distinction between your ‘Average Joe with a mean top speed during a storm’ and your ‘Billy Whizz with high average tempo’. The second score I’d then have would be a ‘KOMhunter’ score, taking into account just the top 10-15% of your segments.
A Hillclimber score would also be interesting, although having chosen to live in a country that’s flatter than a witch’s tit I unfortunately won’t be competing in that one on a day-to-day basis!
In an ideal world there’d be a wind factor built into the equation, but I guess that’s just a pipedream…
Wesley Van den Berg says:
Even though I’m personally interested in general performance, I *was* thinking about this pain bank thing on the way to work (laid myself on the pain bank three times ;). If you really want to have the score to represent “pain bank performances” you might – disregarding complexity, but maybe you can play off this – only take the position scores that are “average + 2sd” for a rider. This will give back only the best scores that rider has.
In addition to giving a purely “pain bank performance” score. It might have some potential, which I wouldn’t know how to simplify. The amount of included scores (or mean and the sd itself) can tell a person something on their general performance as well.
Come to think of it, maybe a distribution chart with a line where your score is and shading over the part of the chart that is not used for the score… I don’t know, just playing with this pain bank thing…
Wesley Van den Berg says:
Okay… been looking into my scores a bit better since this was posted by Ben a couple of days ago and I’m starting to see the reasons you would only want to have the score reflect your “pain bank” attempts… there seem to be a lot more people really segment hunting than I expected, so with normal “tempo rides” (say around 36 km/hr) you can still be in the bottom third if its a segment with lots of hunters…. I was expecting only 3 or 4 of “these people” max for a segment 🙂
This does put me more towards the “pain bank” score (eg. reducing the segments used to the ones where you really went all out on). How to best determine which segments this are is a bit harder to do. However, with a VV score leader board the score creep at the top might be less of an issue?
BTW, 3 1/2 year old and 6 month old here… it only gets worse 😉
Ben says:
The original concept was that it would just reflect the “pain bank” efforts but looking at my scoring list most of my top 300 segments have been from visits to various pain caves, what can I say, I like pain! Lots of duplicates in there though. Having the 100 limit hopefully will encourage people to attack more segments if they haven’t done so already but also be a usefully large enough number for those of us with more to still be able to find ways to improve.
It would be good to have heartrate values at a segment level so we can see better which we were properly trying for but I’m not sure if I’ve got a way to get at it easily via the API.
I’ve got a 3 1/2 year old as well so I’m aware of what is coming. I’m just hoping they’ll keep each other entertained in the years to come!
Wesley Van den Berg says:
I was also thinking of using the HRM or Watt data from Strava if possible. But I guess a lot of people, like myself, usually ride au naturel and I’m not to sure that the Watts Strava calculate actually make sense 🙂
I share your hope… got some examples of infant war around here though, so its hope against hope 😉
John Bytheway says:
Yes i think there are far more segment hunters out there than will admit, plus for me if using a score to compare riders it only works if riders are flat out at least then you have ultimate pace as your marker. Personally i always try to keep things simple and that is why i thought a 15%50 ratio would give segment hunters a way of comparing themselves without the calculation getting too complicated.
I do still like the idea of 2 scores though, a vw score perhaps using 50-80%150 for tempo riders, and speed score at 15%/50 they are easy numbers for people to understand.
Is it just me or is it confusing trying to find new comments in this blog, i have to scan up and down to see when comments were posted…..probably a stupid question but is there any chance you could set up a vw forum Ben, being able to pm people would be a major advantage compared to Strava, and following a thread from top to bottom would definitely be clearer.
Ben says:
Can you subscribe to the comments for a particular post? I get emailed each time a comment is made which makes life much easier. I think this is a fairly standard layout for comments sections but I’ve not had such a good, interactive discussion before! This along with Facebook and Twitter is already too many places for me to keep up-to-speed on so no intention of adding another.
As I just replied to Wesley (immediately below I think!) I’ve got at least 200 segments that I’ve visited the pain cave on (lots of duplicates so probably half that number in reality) so reducing it below 100 would make it hard for me to find ways to improve my score. Just take it as a season long goal to get 100 pain ticks!
BTW what is the VW (VolksWagen) Score? Auto-correct?
John Bytheway says:
I was kinda thinking of veloviewer forum and get rid of FB and twitter and keep it all in house….man you hit that pain button waay more than i could even think about, i only do it on hills and there arnt 100 hills close enough that i would want to target.
re vw score… brainfade thinking about having to work 12 hours tonight!
Ben says:
A forum has almost no viral marketing capability whereas Facebook is now where I get the majority of my site referrals from. My own Twitter tweets don’t result in that much traffic but when other Twitter users with 10,000’s of followers tweet about the site everything goes crazy! If I wasn’t on Twitter then those types of things wouldn’t happen half as much.
All my pain button presses are on categorised climbs as well. Lots to go at around Sheffield, but that’s why I live here!
Michael Jervis says:
The problem (with the comments) seems to be that they aren’t appearing in order correctly in the replies to other comments. So some of your earlier responses come before others. But, that might just be because there aren’t enough “levels” of nesting for a thread.
Michael Jervis says:
And… if you change the sort from “best” to “newest” or something it’s a lot easier to read the comments.
Michael Jervis says:
T he segment score works. The problem is the merge of your best 25% which as you note skews things up to high ‘boastable’ scores that look like top 88% until you read this.
So. Why not display the overall average of all scores and head it with the percentile of the current score. So my vv mark would be 55th percentile based on a vv score of 82 (42 over all rides) or something.
So your score is in perspective and you can see how much it is skewed by pushing on your best score segments.
You couLd add other email scores to provide other ways to push it out. Total segmentsI against frequency or distance. So to promote exploring irrespective of cycling time (I. E. Someone who does 4 hrs a week could explore score as highly as someone who rides 20…)
Ben says:
I think I’d like to keep the Score as simple as possible and just a single value. Showing a percentile based on other people’s scores becomes a bit of a moving target as more people join and would mean lots of repeated, hefty calculations working out the distribution each time anyone updated their data.
If I can just apply a formula to the existing score to spread the distribution at the top end then that might be enough. A separate debate could be had around whether 25% and 100 segments are the right numbers though which is being discussed in other threads in the comments here.
I’d like to try and work out the explorer score by trying to look at your activity gps data and work out how much unique routes you have taken. Dividing that by the total distance might give a useful explorer score. Can’t really use segments for that as some areas have next to know segments per km and others have hundreds!
Michael Jervis says:
*probes server* ah, php on apache. I don’t suppose the backend is SQL Server is it? Bet it’s MySQL?
Shame, as MSSQL has a nice function that makes giving centile positions based on a field in a table for a very large dataset trivial.
The advantage of centiles is having MORE people on vieloviewer doesn’t mean your centile rank will go down or up, necessarily, they might meet the distribution of your existing user base. However, if lots of elite riders joined, then suddenly, yes, you may ‘dip’ a bit.
Need that graph you have available on the site, regularly. Maybe once a week/month refresh. So you can see if you’re “improving” up the pack or if the pack is moving with you. Not that I obsesses over my (poor) stats much. My 2013 score is not looking good. So I need to see every thing that changes and how that’s progressing me up the ladder )
Ben says:
Yep, MySql, I’ve got children to feed 😉
I can easily update the distribution every couple of weeks and display it on the summary screen along with your own position so I should do that at some point. It would be good getting to the bottom of if and how the score should be changed for the better before I do though. Calculating your percentile isn’t that bad either and I have a query that does that pretty quickly.
PeteB says:
Re the scaling of score. Completely agree that the score for an individual segment is calculated well right now.
I actually quite like the way these scores are combined by the 25%/100 rule too. It means that a relatively poor rider like me gets a score that sounds quite good! e.g. I’m at the bottom of the third quartile but still gets me a score of 77/100 which it encourages me to keep going and I have noticed it inch up with more rides getting noticed). So possibly nothing at all needs to be changed. Though all those people crammed together in the 90s might feel different I suppose…
[p.s. Is it possible to see the snazzy graphs that were v2 in v3?]
Jessica Hamilton says:
Something else that might be worth considering is filtering out segments with unrealistic VAM, as they’ve obviously got hideous GPS data, making the segments not really representative of anything useful.
Ben says:
Because the elevation/VAM of a segment has no bearing on the score value itself then it shouldn’t really matter. There is a good chance that the segment itself is of little value as it was probably auto-created. Check out one of my first blog posts: https://newblog.veloviewer.com/bad-strava-elevation-and-distance-data/ You can get in touch with your local Strava Ambassador to sort out these segments too.
Domenico Della-Ventura says:
Have 2 scores – one as is now (or with any tweaks being suggested by others) and another which takes the position per segment using the average rider times (assuming you can get this) OR use 25% of your best most ridden segments rather than your best 25%. But to be honest – I am not fussed as I use it as a motivation to get on my bike and get fitter and faster! It allows me to access the data quicker than using strava website directly. Keep up the excellent work, Dom.
Michael Jervis says:
I think there are two distinct issues under discussion are there not?
1) The average of your top n segment scores is naturally skewing figures to a compressed area.
2) Is 25% (max 100) right?
I think the segment score is pretty solid as it is, it works nicely. No one seems concerned by that. I like it greatly, very nice way of “levelling” segment performances.
So, to deal with 1, the ideas have been to “spread it out” with a log function or similar, or to use a way of showing how it fits in (percentile) to give it more perspective. Personally, I like the percentile, it’s a good way of seeing where you fit in on the crowd. But it’s computationally an issue. (Given the DBMS in question anyway ;-))
If spreading it with a log makes it more clear where you fit in, so that seems good too.
Now, with the number that count, I prefer percentage with no cap.
It means a prolific rider with lots of segments can focus more easily on improving their score on a mere 100 candidate segments out of their available selection. I have 805 segments, and ok, so a lot of them are poor scores. But, I could pick only 100 of them and work hard on segment hunting them.
If I have to get good scores on 200 of them, then that’s making me ride a lot more ’rounded’.
Anything that’s based on scoring highly on a segment (for example a leader board on strava…) is going to encourage segment hunting. So if you make it a broader selection of segments it’s getting more as a rider all round, how do you go?
That’s why I like the explorer score idea, and perhaps some overall ride score mechanism. I get an Epic suffer score a /lot/ despite my low segment rankings.
That’s got to count for something. I may not be KOM on Curbar (which I have a serious love/hate relationship with…) but I averaged a HR of 184bpm on my PR (http://app.strava.com/activities/68401722#1319749686) and so did the guy who’s currently #3 on his PR (http://app.strava.com/activities/63718836#1206151998) (Ben doesn’t have HR data out there, neither does #2) that’s got to count for something. I’m as deep in the pain cave too. Just maybe not been training as long, or as much (#3 averages 12hrs a week, I average 4. Kids…)
Ben says:
I like the idea of the Explorer Score and will have to try and work out how I could actually go about working that out. Must be possible. It would be a good alternative for those people whose goal is to ride new roads/trails and would compliment the current score.
In terms of 1) then I think I can spread out the values at the top end pretty well which wouldn’t affect actual or percentile positions at all and wouldn’t cause any extra performance hit. I could still display a chart showing where you fit in and provide a percentile. I don’t want to alienate those users who are down the bottom as nobody wants to hear that they are in the bottom percent.
You can only really only compare HRs between riders on a segment if you know what their max rate is. Dean Downing has a max HR of about 145 bpm whereas mine is almost at 200 and we’re about the same age.
Michael Jervis says:
I take it the MHR and suffer score aren’t in the API?
The suffer score comes from the MHR and points in red etc, if the HR data and suffer score was in the API, running off the suffer score (or working out a suffer score for…) the segment?
But I’m guessing data just not provided.
And if DD’s MHR is 145, then, he deserves to score poorly on a system based on my MHR 😛
Sandy says:
Would it be possible to have a veloviewer climbing score? e.g. only take into account segments with an average gradient of 2% or greater?
Ben says:
Hi Sandy. If I did I think I would base it on categorised climbs only as anything below 5% is basically flat isn’t it! If they are categorised then the VAM gives a clear indication if the segment has bad elevation data as well so easier to filter out or fix.
John Bytheway says:
Beginning to think i must be argumentative 🙂 as i dont agree with you at all on this one Ben, by your own admission your stats are well outside the average member, what you have to consider is we dont all live with cat 4 climbs outside our front doors, i just did a strava explore my area for cat 4’s weirdly there are quite a few in my town all of which are bad data as they are no where touching the start of a cat 4, the closest actual cat 4 is about 20-25 miles away now i pretty much do all my riding from home and am limited by time to around 25-30 miles so i never get close to them and i am sure a significant number of your 9000 members are in a similar position.
I totally agree with Sandy that a vv climbing score would be really interesting although i would use a higher % than Sandy probably around 3.5 to 3.9%, i know we have discussed this before because i remember asking you about creating VAM results for non cat climbs you were not keen but i still maintain whilst there would be clearly some misleading results, for specific climbs that are purely straight up with average gradients of least say 3.5% and higher the numbers for the individual irrespective of whether they are part of a vv climb score or not would be really interesting and another motivational number to train to increase…..i say this because i use another site to work out my vam scores for short climbs and i do find it motivates me to increase the numbers.
I dare say i am not the only one that has a pretty much blank column when looking at my segments in the VAM section, i do not see why hills or “bumps” of 3.5% and higher could not have a different colour text VAM to signify they are non cat results and subject to a lot more interpretation…..it would be up to the user to decide if these results are worth using or not.
For me the point of vv is access to data and numbers that strava simply wont/cant be bothered to give us, from that perspective i would prefer you to give us as much as possible and let us decide what we want to use…..even to the point of “at some stage” making the summery page completely user configurable to show what actually matters to each member.
Matt C says:
Hi Ben – I like the idea. I do have concerns reagrding the sheer volume of duplicate segments on some of the more popular hills – Boxhill, Toys Hill, Kidd’s Hill, Ditchling Beacon being obvious examples around the Surrey/West Sussex area!
One to progress if and when Strava ever clean up their database of segments…
lukwe says:
to recap I would try adding several filters:
*minimum length (elapsed time)
this cuts out lots of bad data segments!
-250 meters minimum ?!
*give different weights in the sum to climb categories
and/or cut out cat 4 and below.. on flat segments performances of people riding solo cannot be compared to clubrides; while you’re always alone on a climb!
* find a way to filter duplicate segments, this has the biggest skewing effect when combined with ‘take top x% of segments’ ( I never looked at the API and I have no suggestion about how to do it)
*log(alltheabove) to have a more readable, spread out scale.
or maybe we should all by a powermeter and just post our FTP
ciao, welcome back
Wesley Van den Berg says:
All my comments to this have to do with the fact that my country is a baize.
* minimum length; though I do agree that short segments generate crappy leader boards, its basically the only way for people here scoring their MTB work. Anything over 15% will tend to be very (extremely) short. Even though I’m not very good at these segments, others might be 😉 So I would be careful eliminating anything that is short. I *would* suggest an elapsed time limit, maybe based on accuracy / recording interval of GPS in general? I don’t know enough of that to work out a suggestion.
* Flat segments is al I have and all I can get without a days travel, don’t punish me for the land I was dealt 🙂
* This would be great, but seems impossible and sometimes unwanted (there are some long segments here, which have some short segments in between, which are both fine for different reasons). I keep my hidden segments on Strava pretty organized to get the crap out. Maybe there should be a button to refresh your data (now I can delete and reload the data, which also works) in order to get out hidden and removed segments? A button for this would allow you to see what changed.
* Log would be fine, VV score leader board insane! 🙂
lukwe says:
I agree, elapsed time would be better than segment length; or maybe filter on the ‘elev/distance’ i.e. the flatter the segment the longer it has to be to be considered, while very steep short climbs are always kept.
Nevertheless I still think flat segments are difficult to score/rank compare properly, aside from clubrides it is very easy to score high by just waiting for the right wind! having a minimum length and different weights on climb categories would only make the scale more correct, it is not a punishment on people who do not have chances to climb.
Duplicates segments are THE problem for the Strava community!
vote for it on their support desk to make sure it’s a priority for the devTeam (http://veloviewer.com/athlete/39763/).
Maybe ‘veloviewer-score-wise’ they can be filtered by looking at the times of the actual ride:
if (abs(seg_A_startTime – seg_B_startTime) 30 sec);
}
elseif (seg_A_endTime – seg_B_endTime 30 sec);
}
else {
duplicateAB = false;
}
this would preserve short subsegments inside a longer one, but cleans those with similar start and end points;
if duplicateAB ? (choose_seg_with_more_riders() ) : ( );
Matt C says:
I emailed Strava about this (duplicate segments) and I would recommend that you do as well.
Basically my suggestion was that they should cull their database of all broadly similar segments and then going forward, if a proposed new segment is similar (to be defined but Strava do have an algorithm that considers this when setting up a new segment) to an existing one, it would be defaulted to “private” – either to you as an individual, those you follow or follow you or alternatively private to a club. Your choice as creator.
I did get a response but they said that this is something to add to their “to do list”, which I guess means that they won’t take action unless they pestered!
parmijo says:
Is there a way to extract whether the athlete’s ride was with others (group ride)? Strava’s ride info always shows who else was on the ride. If so, then a filter could be added to differentiate between group and solo. For some reason, Strava has been reluctant to add group/solo.
Ben says:
not that I know of, although this is available in the phone apps so must be in the API. Whether I can find it and have access to it is another matter!
badger says:
A problem with this is that strava often says I was riding with someone when I simply passed them (or was passed) and we rode on the same roads for a while – not even 1/4 of the ride distance some times…
Olly says:
I’ve a question.
For the first time I clicked on the ‘check placings’ and ‘check for new segments’ buttons under the update tab and my score fell by about 1.5.
Isn’t it possible for people who don’t do those updates to therefore maintain an artificially high score?
Richard Slaughter says:
So here’s a question – I’m more concerned with score progression than I am with score itself, and I recently moved across the country. So, a lot of my better segments are segments I no longer have the option to ride. Is there any way to prevent them from being considered in my score?
Josh says:
Two things I think would be nice. First, instead of rating it on the number of KOM attempts, it should be rated on % of the KOM time. For instance with the current set up, if it is a 5K run and the top time is a 15:20, the second best time is a 15:21, but then third is 17:50, the second best time should be much more heavily weighted than the third place time. The next addition would be in calculating our VeloViewer score, you could calculate the same number, but then the veloviewer score would be the percentile that we fall in from all of veloviewers.
Awesome site by the way. Love it.
Luis Gutierrez says:
I did what was recommended that took a look at the segments that were lowering my score.
There were plenty there that were about 3 years old, or that I’ve only ridden once (in trekking tour).
Perhaps it will worth to limit the score to the last year/quarter/month or to avoid it picking up segments that were done less than N number of times?
Ben says:
Even if the PR’s on those segments are a number of years they are still you best scoring efforts. Removing them will only lower your score (unless you’ve got less than 400 segments). Basically, to get those old efforts out of your score you need to ride more segments and score higher than then they will fall off the bottom of the 100 segment limit.
Wesley Van den Berg says:
Hi Ben… would it be possible to display the VV score of VV users in the rivals page? Would really love to see how my friends and foes 😉 are scoring
Tom Smart says:
When I go to segments and choose the scoring option, I get a list of 216 results. I would think according to the calculation I should only get 100 results. I think your limit of 100 is appropriate because I can see in my case that my worst results were ones where I wasn’t even attempting to ride fast. I even took time for a phone call and pictures. I ended up with a placement of 1500 on those segments. I could do the ride again, but it’s not in my home town. So keeping the limit is good, in my opinion.
In my case, is something going wrong?
Konrad says:
Hi Ben,
How about updating the VV score distribution chart? My score has gotten higher in the past few months – not sure if I’m getting better or is it simply a question of Strava being discovered by the beer gut Pinarello crowd
RickB says:
I think you should throw out all segments that have a total athlete count less than, say 25 (or some other reasonable figure). Then apply the formula to the resulting list. There is no reason to penalize someone who rides segment(s) that are more remote or in areas not well travelled. The formula generates a lower score for those segments that is not indicative of their true performance.
Ben says:
Not sure that would go down well with my wife. Lady’s scores are based on the QOM placing and count and even around here in Sheffield lots of segments can have very few athletes.
If there are less than 25 athletes then your potential score on that segment is fairly limited anyway so natural selection should push that out of the scoring zone pretty quickly if you also cover better ridden segments. It’s only your top 25% of scoring segments that are used (max 100) so shouldn’t really have that much affect. Maybe it will just encourage you to cover off some more ridden segments to improve your score?
Duplicate segments have a much larger impact on wrongly influencing the score than this and there is no way for me to do anything about those so best just to take the score with a pinch of salt.
Konrad Kowara says:
Hi Ben,
Any chances of recalculating the VV Score distribution chart? I’m curious to see how dynamic the distribution is, assuming everyone on VV has worked their butts off this season to improve their own scoring (I know I did!)
Ben says:
I’ve added some updated numbers for you below the graph. I’m not a statistician so can’t tell you what the change really means but I get the feeling that if you’ve improved your score then all that working off of butts has been well worth it. Time to reward yourselves with a winter season of undoing all that good work.
Konrad Kowara says:
Thanks Ben! As expected with such a big sample group (>20000 athletes), the Score distribution will be pretty static and will not change much over time. Still, good to see my assumptions matched by actuals. And I’m not much of a statistician myself, but I’m guessing that the median score lower than the lower percentile can only mean you made a typo and typed 6 instead of 8 :).
btw. Winter season storms are coming – both in NL and in UK. If anything, it’s a perfect time to improve the VV score for those equally ambitious and suicidal!
recep yuner says:
Hello Ben. I like the veloviewer score, it makes me ride with more ambition.
I have two points about this:
– When I filter my score with my road bike, that I’m using till April 2013, my all rides score and 2013 rides score are different. But it shouldn’t be. when I choose all it says “From 42 of 169 segments.” when I choose 2013 it says “From 33 of 131 segments.” But in fact segment count is the same, because I didn’t use the bike in 2012. I think there is a little mistake about this filtering.
– It would be very nice if we could see our progress using veloviewer score. Maybe a chart showing our scores over time?
Kwizzle says:
How do you take into account Strava users who ride in areas with hillier segments? For example, a person who rides in the San Francisco bay area will have much harder segments to deal with vs someone who rides in somewhere in Texas which has little to no elevation change? If someone from San Francisco were to ride in Texas they would probably have a better chance of ranking higher on those segments due to the fact they have been training on harder terrain. On top of that, riding in the bay area is more difficult to place higher on segments due to the tougher competition since that area tends to attract more competitive cyclists.
Ben says:
Just be glad you don’t live in Belgium – far fewer riders and the a much higher average in ability to any large cities which combine to make high scores far harder to come by. And the hills in Belgium (not to mention Holland) are probably similar in stature to those in Texas and that doesn’t stop people from those countries being rather good cyclists.
Its just your top 100 scoring segments so they could easily all be flat segments from outside the bay area given a couple of rides further afield but if they are less ridden the scores you will get for a higher placing will be less as it is based on your relative position.
GDV says:
I really like the VV score and tend to disagree with most critical comments. It is indeed favouring people who have older GPS data or who ride > 400 segments per year, as the 25% and top 100 limits make them get rid of most of their low scores. But the per annum score compensates for the first and as for the second, well, everything in life is affected by how hard you are trying, so I would count this as an advantage…
As usual, however, some additions would render the score even more informative. For one, getting some statistics about VV score distributions overall and per year would help interpret what the score really means (a distribution plot was posted some time ago, but if I am getting it correctly, as more people are using Strava for a longer time ever more users will be leaning towards the 100%-score). For another, adding a VV-score to the Summary’s climb category overview (one per category or some sort of KOM-score for climbs in general) would be really interesting for all climbers among us ánd compensate for overly high VV-scores obtained through group rides.
I realize I am actually nitpicking. I totally love your site; it makes me want to go out and ride my bike, something I never expected a website would ever do…
shjac says:
The distribution of scores on VV would seem to be skewed in favor of those using veloviewer. My guess is that of all cyclists, the majority of those using strava are relatively quick and those interested in tracking their performance against others on VV are a select cut of those. So VV users are likely to have high scores because they tend to be quick and competitive. The score distribution of all Strava users would be more normal.
Ben says:
If the score was calculated using all of your segments that we’d get a more of a normal distribution but seeing as it is only your top scoring segments then it is definately going to be skewed towards the top. I didn’t want to penalise people for going for the odd nice, leisurely bike ride from time to time!
Marcello says:
Hi, Veloviewer is a great tool to help motivating my rides. I just wanted to ask, if possible, to post an update of the “Score Distribution Chart”. Another great feature would be to have a global ranking based on VV scores…
Ken Wood says:
I have moved from the UK to the Alps. The majority of my counting segments are from the UK but obviously I won’t be improving them! How do I make an impact on my score?
Ben says:
Cool that you’ve moved to the alps but unless you are a 55kg mountain goat you might struggle to improve your score! Some very quick riders out there. Only thing you could potentially do (if you weigh anything like what I do) is target the valley road segments, or just go and enjoy yourself!