Map
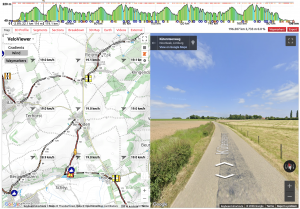
Race route coloured with the road gradient using the standard VeloViewer colour key depicts:
- Waymarker locations.
- Distance markers that automatically provide more granularity as you zoom in.
- Zooms straight in to section selected in top profile.
- Street View provided where available.
- Holding the Control (Ctrl) key down when moving the mouse pointer over the top profile moves the Street View man to that point along the route.
- Full screen for the map and Street View available.
Selection fine-tuning button map zooming
Fine tune your selection from the route using the left and right arrows. Hold the SHIFT key or ALT/OPTION key when clicking the red arrow buttons the selection will jump by a larger amount.
StreetView Man and Snapping
There are two ways to get the StreetView man to a position along the course:
- Hold the Control key down on your keyboard while you move the mouse over the top elevation profile. If you stop moving the mouse whilst over the elevation profile (while still holding the control key) then StreetView will be opened and the man will jump to that position along the course… as long as StreetView imagery is available for that location.
- Manually dragging the StreetView man to the desired location.
When the StreetView man is deployed, it will automatically jump to the nearest location along the course itself. StreetView snapping can be turned off in the settings, the cog in the right-hand corner of the map
Weather
- Top right grey box – shows the weather forecast for the cursor location on the top elevation profile.
- Move the mouse along the elevation profile to see the expected weather at that location:
- Rough date/time for that location on the race.
- Icon showing weather e.g. partly cloudy, rain etc.
- Temperature – this is the “apparent”/”feels like” temperature which takes into account humidity and wind strength.
- Wind speed – general wind speed rather than speed of gusts.
- Wind direction – blowing in direction of arrow where North is up. In the example above the wind is blowing from West to East.
- Two horizontal lines above the elevation profile:
- Grey/blue line – shows cloud cover and rain intensity. If there is no grey/blue line then it should be sunny.
- Orange/red/white line – shows the wind in terms of risk of echelons. White is a headwind or tailwind, orange is a cross headwind and red is a cross to cross tailwind. If the wind drops below 15 km/h then the orange/red begins to fade and disappears once below 10 km/h.
- Arrow above the two lines displays the wind direction as it hits the riders at that location. Coloured in the same way as the orange/red line.
- Arrow next to the current location on the map – coloured the same as the arrow above the lines but showing the wind direction compared to the orientation of the map.
- The weather forecasts are updated every hour and will show for up to 7 days in advance of the race day.
- The cross-wind warnings don’t take into account the topography, trees, built up areas or anything else that might mean the wind isn’t an issue. Use the orange/red areas as a guide to help search for the most likely areas that will be affected by the wind and then use StreetView to check if it is exposed or not.
Wind map
In the top left of the map when viewing a route there are three options:
- Gradients: The default view showing the gradient colours on the map route line.
- Wind: Replaces the route line gradient colours with the colours shown above the elevation profile to represent the risk of peloton-splitting crosswinds:
- Red: Cross and cross-tailwind.
- Orange: Cross-headwind.
- White: Headwind, tailwind or just light winds from any angle.
- Waymarkers: Toggle on/off the waymarkers on the map.
When using the “Wind” option, arrows are also shown on the map showing the wind direction and strength (white arrow for light wind going through to black for stronger wind). These show the wind forecast across the map for the time of day corresponding to the current position of the marker on the elevation profile.