Upcoming Races
Races that are displayed in the Upcoming Races section are those that the user with Race Admin access has selected for your team or, if you are an Organisation, pre-allocated. The races will appear here if the routes are already populated else check in Planned Races.
From this section you can:
- Add Training Camps
- View Summary of races
- Access Route details
Order and Filter
- Ordering by Race date or Last added/updated.
- Filtering by team types i.e. All/Men/Women/Conti and My Races.
In both cases blue denotes the selection currently active.
WBGT (Wet Bulb Globe Temperature)
The WBGT values in VeloViewer should be used as a guide. It is recommended that you obtain weather forecasts from other sources and enter them into the UCI SpreadSheet for comparison.
Annex C of the UCI Regulations (part 2) details the “Protocol for discussions regarding high temperatures and the riders’ safety during events”. The regulations relate to the Outdoor WBGT.
Wet-Bulb Globe Temperature (WBGT) is the standard measure of environmental heat stress, accounting for air temperature, humidity, wind speed, and solar radiation. It is widely used by sports leagues, the military, and OSHA to evaluate heat stress risk and prevent heat-related illnesses.
From the UCI perspective, the risks assessment can be expressed in the form of a colour code:
- White zone (WBGT below 15°C), very low risk;
- Green zone (WBGT between 15°C and 17.9°C), low risk;
- Yellow zone (WBGT between 18°C and 22.9°C), moderate low risk;
- Orange zone (WBGT between 23°C and 27.9°C), moderate high risk;
- Red zone (WBGT above 28°C), high risk.
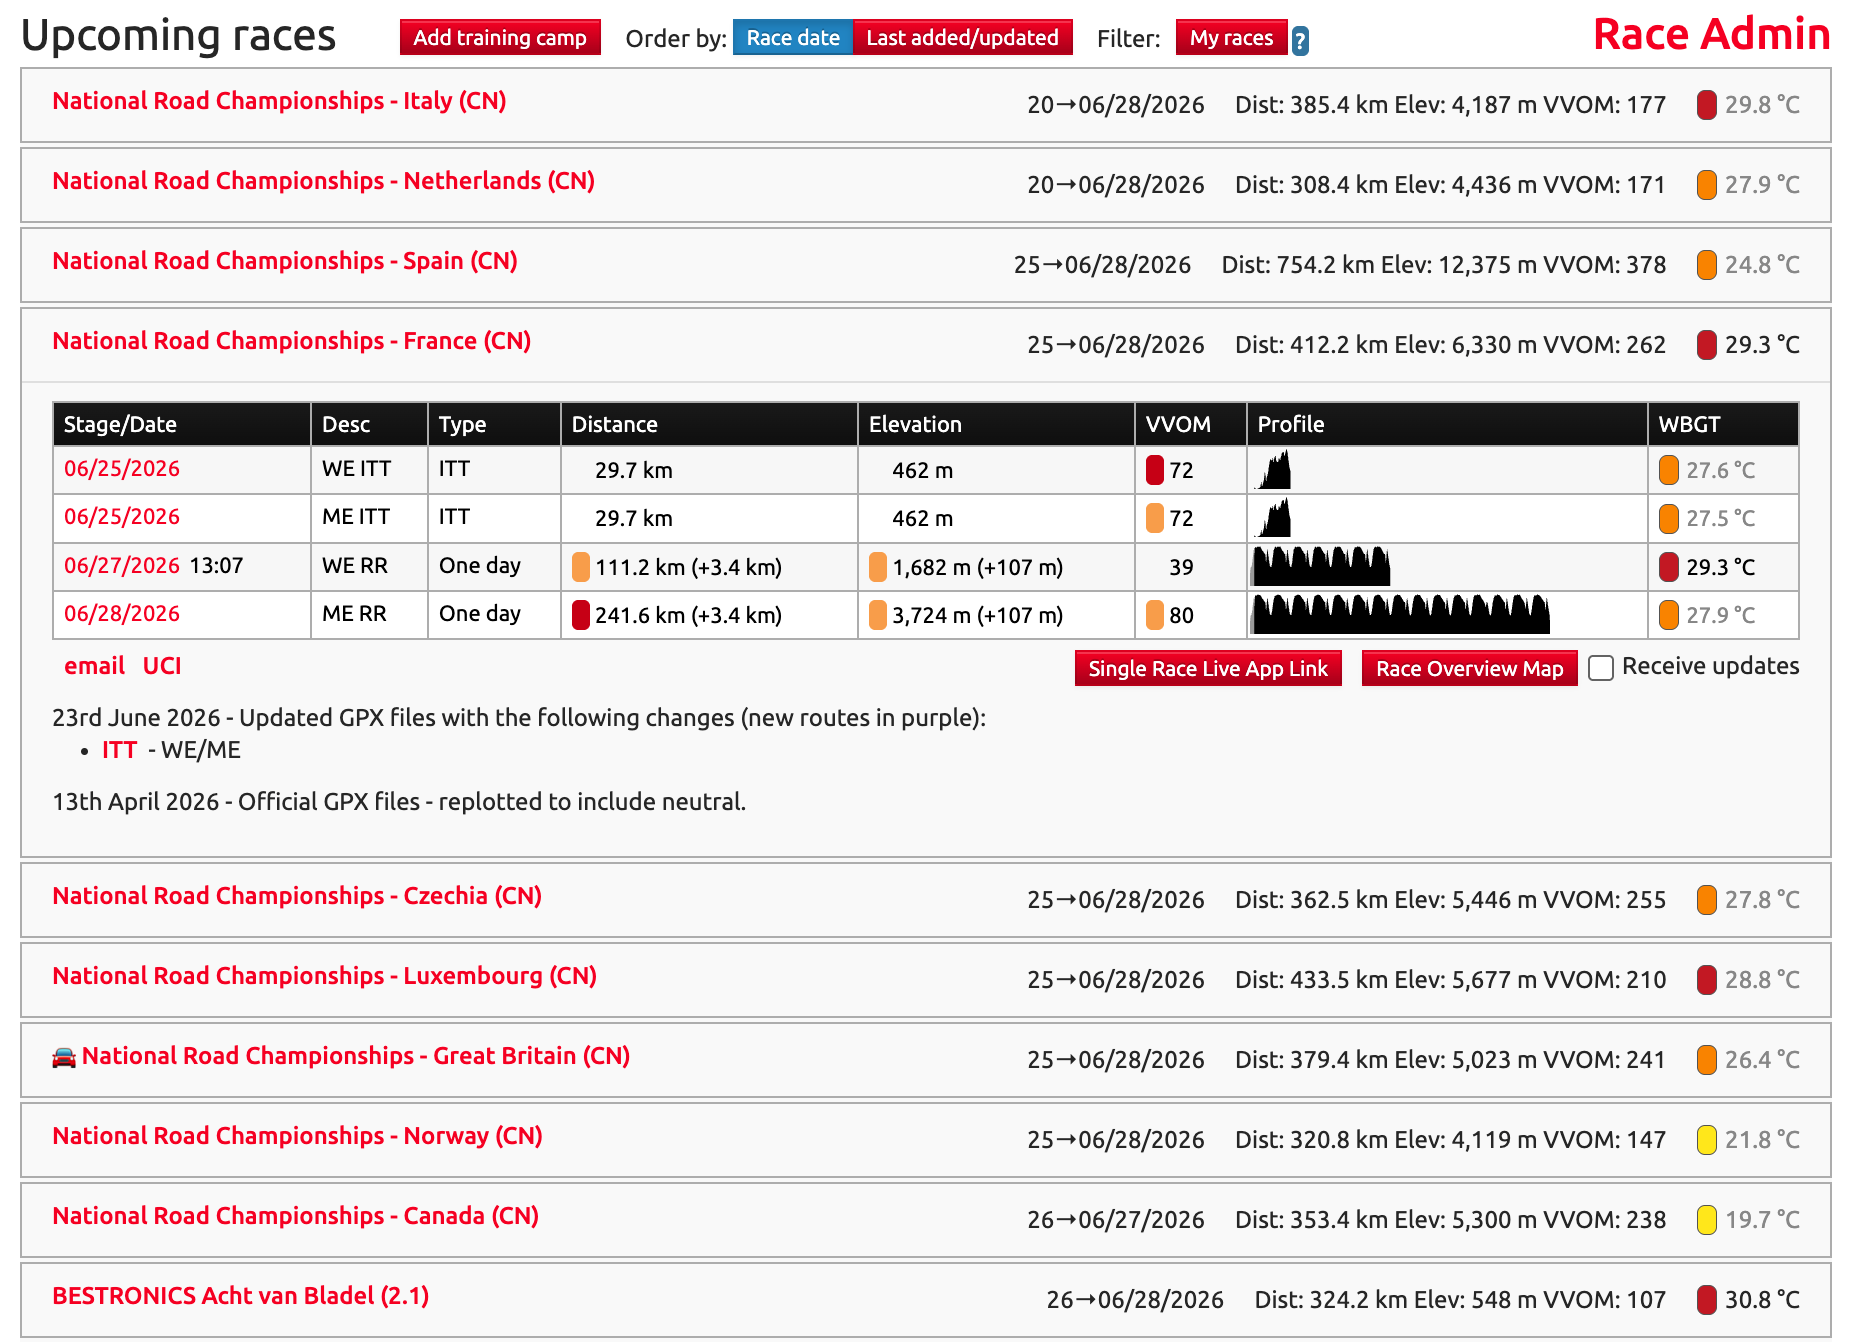
In your Race Hub you will now see the max WBGT for each race/stage. This will be calculated when a race/stage is opened with 7 or fewer days before the date of the race when the weather forecast is available. This WBGT calculation uses the same logic as used in the UCI’s spreadsheet and is using the Apple WeatherKit forecasts used throughout VeloViewer.
If the km zero start time has not been set then the weather data will be based on a 11:00 am start and will be grey in colour. Setting the race start time at the top of the waymarkers section (and the expected average speed) will provide a more reliable calculation.
In the Race Hub the max WGBT across all stages is shown on the top line with each stages’ max value shown in a new column:
When viewing a race route, the WBGT is shown in the top right for the current marker location on the elevation profile:
If you are on a computer with a mouse, hover the mouse over any of these values for a full breakdown of information regarding the weather for this location and the amount of time/distance across the route spent in the different risk zones:


