 Most of you by now will have tried out the new activity details page on VeloViewer but in the depths of a northern hemisphere winter, here’s how you can use it to find your Functional Threshold Performance (FTP) in conjunction with The Sufferfest’s Rubber Glove video from the comfort of your own kitchen/garage/cellar/gym.
Category: Charts
The Climbs of Stage 2 of the 2014 Tour de France – Part 2
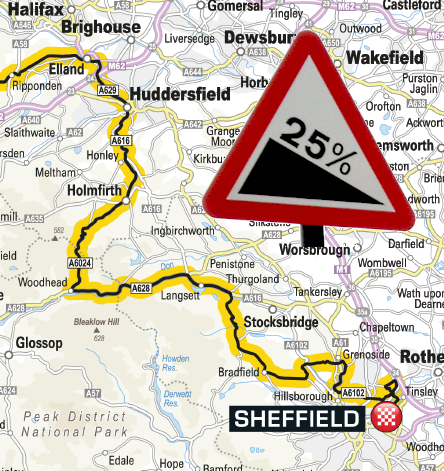 In a previous post I covered the climbs of the first half of stage 2 of the 2014 Tour de France on its way from York to Sheffield (also available is the climbs of stage 1). This post will cover the remaining climbs of the stage that could well be providing a safe pairs of shoulders for both the Yellow and Polka Dot Jerseys for a good number of days. Holme Moss is certainly the biggest climb of the day but the many small and steep climbs (and slippery, twisty descents) on the run-in to Sheffield are more likely to cause the upsets and there is a real sting in the tail with up to a 33% gradient on Jenkin Road just a few km from the line. Tom Boonen and Matt Goss both crashed fairly badly in this area during the 2006 Tour of Britain but hopefully those won’t be the kind of headlines of the day.
The Climbs of Stage 2 of the 2014 Tour de France – Part 1
 Stage 1 may well have been one for the sprinters but stage 2 is being heralded as a proper, Yorkshire, Northern Classic of a stage and that means plenty of climbs. The route takes in almost 4000m of climbing along its 208km starting in North Yorkshire, passing through West Yorkshire, dipping its toe ever so slightly into Derbyshire before the grand finale in South Yorkshire. There are so many climbs that I’m splitting them up over 2 blog posts! In this post we’ll cover the route from the start at York Racecourse up to the climb of Cragg Vale and here you will find Part 2 with all the remaining climbs all the way to Sheffield.
The Climbs and Finish of Stage 1 of the 2014 Tour de France
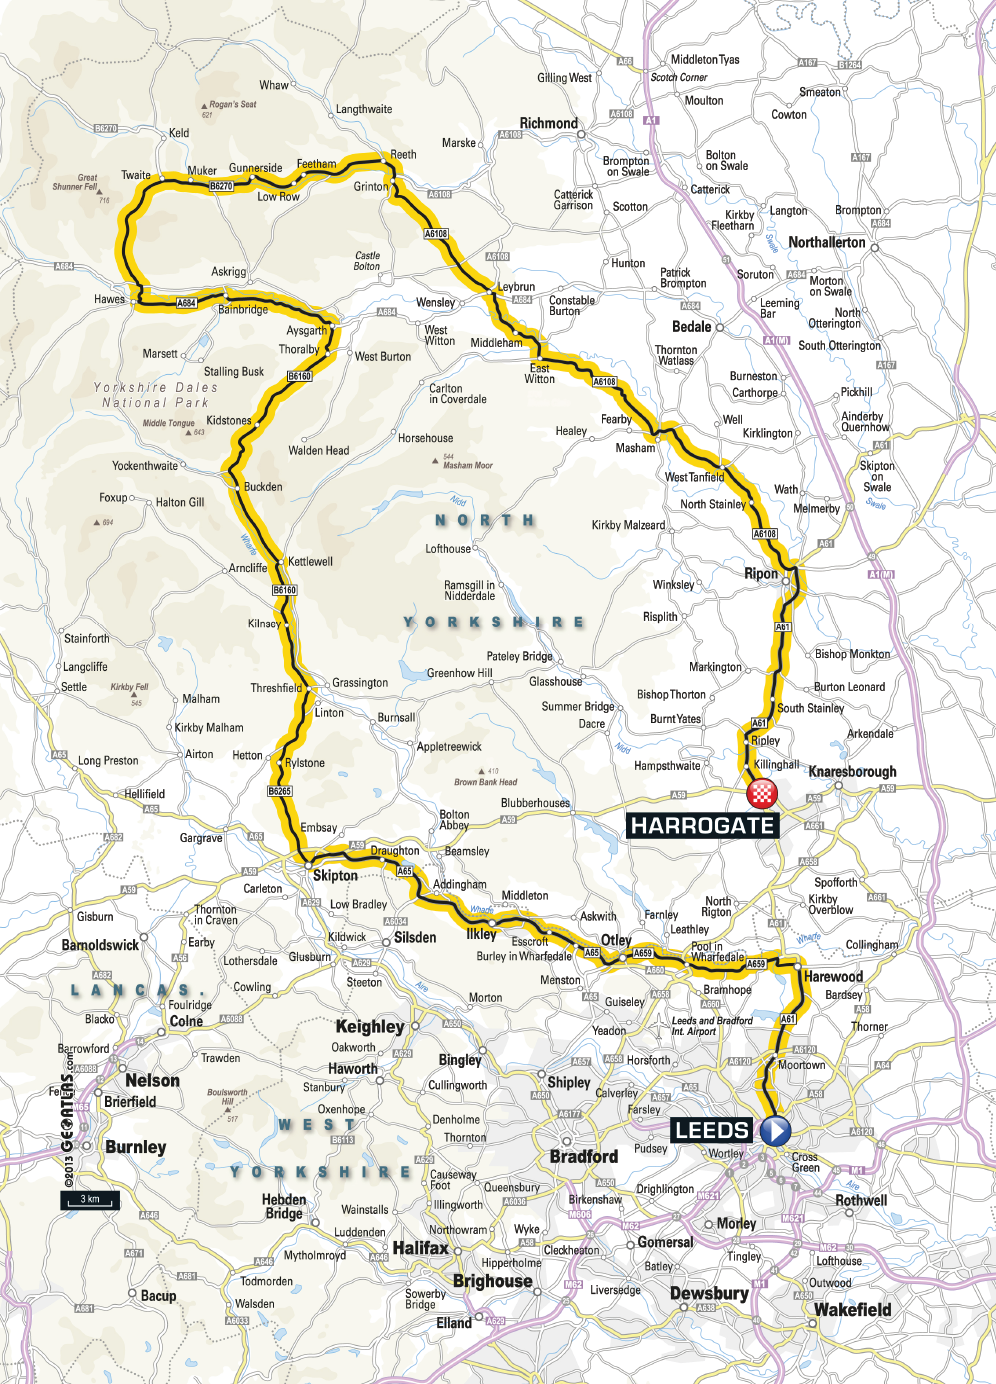 Stage 1 of the 2014 Tour de France will travel from Leeds Town Hall to the spa town (and home of Yorkshire Tea) of Harrogate in just over 200 km (around 2800 m of climbing) and a sprint finish (and a British Yellow Jersey?) is anticipated. But this stage is by no means flat and if you are planning on riding the stage then you might be interested in knowing what you are letting yourself in for.
Holme Moss Climb (Tour de France Stage 2, 2014)
 Holme Moss is a bit of a classic around these parts, particularly because it usually requires a fairly long loop and another major climb to get back home again, but also because it is one of the highest roads in the area and at 524m will be the
 highest 2nd highest (Buttertubs Pass is 526m!) point visited by the 2014 Tour de France during its stay in England. Never ridiculously steep, the climb puts its efforts into psyching you out by laying out the snaking finale in front of you with the majority of the climb still remaining. The Mont Ventoux’esque transmitter tower that sits at the summit of the climb is so unmistakably apparent it is impossible ignore what’s in store.
(photo: @paterson_alan)
Buttertubs Pass from Hawes (Tour de France Stage 1, 2014)
The Buttertubs Pass from Hawes in North Yorkshire will be one of the first climbs taken in by the 2014 Tour de France in the heart of the Yorkshire Dales National Park. I’m not going to attempt to regale you with tales of my epic ascent of the climb as I can only remember about 25 metres of it (and I don’t think I’ve ever regaled anything very well) so I’ll stick to what I know and provide the cold, hard stats!
Photo: Kreuzschnabel/Wikimedia Commons, License
Ride Details, the Missing Link
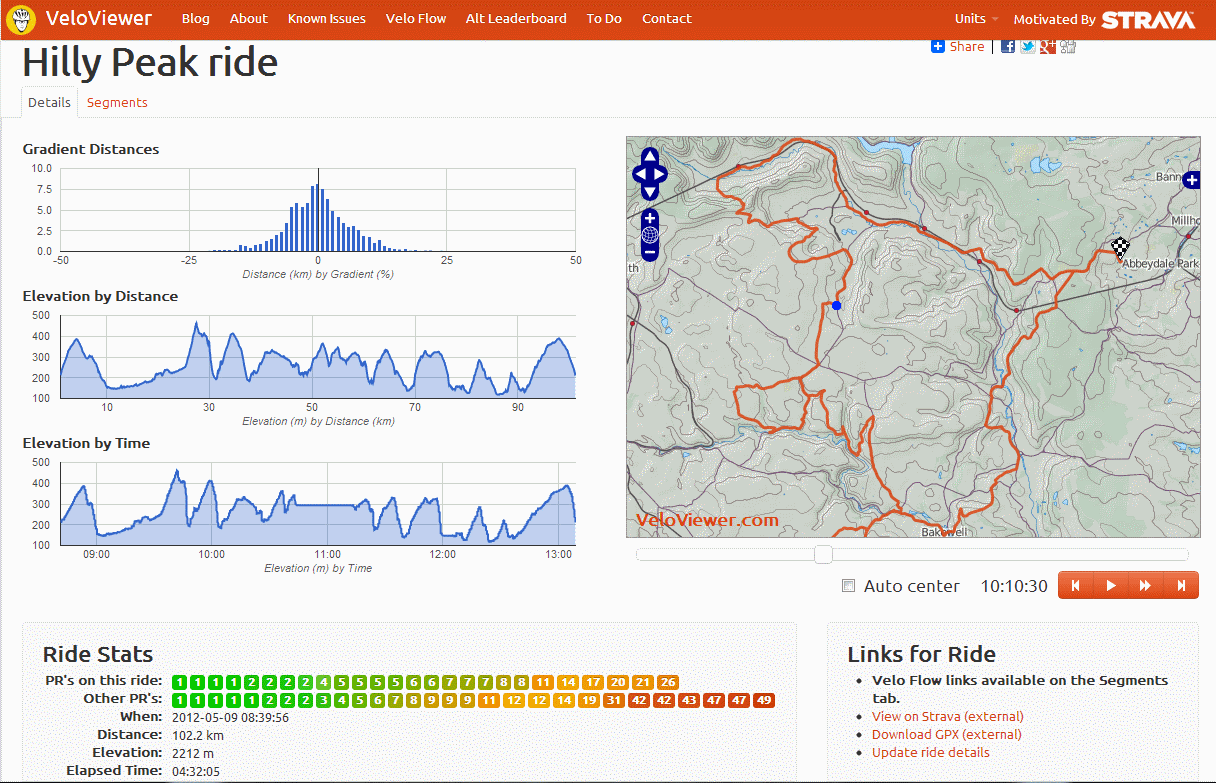 For a long time the main missing element on VeloViewer has been a ride details page. Well, not any more. Very much a version 1 so expect lots of changes based on some things I still want to add and any feedback/requests you guys want to give me. For now though, view each of your rides’ stats, interactive map, elevation charts (including the gradient histogram – distance travelled at each gradient) and lists of all segments covered (on a secondary tab).
Position Score – the Column Formerly Known as Position Percentile
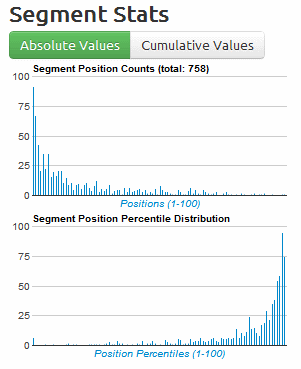 Your leaderboard positions on Strava segments can be a bit of a badge of honour but the significance of each of those positions can vary wildly. If you are 6th placed out of 3000 riders then that is pretty good going but 1st place out of just 2 riders is less so. In steps an suggestion from a forum to include a position percentile column and corresponding graphs, a few minutes later and the first incarnation of the position percentile appeared.
Bad Strava Elevation and Distance Data
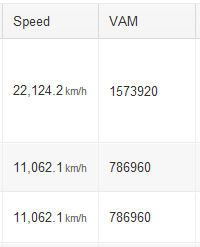 Your stats in VeloViewer are only as good as the data that is passed in from Strava, and around 1.5% (based on sample data I had a couple of months ago) of Strava segments seem to have bad data associated with them. The 2 main culprits are dodgy elevation data and non-matching distance data.
This isn’t entirely Strava’s fault although I believe there are ways that they could clear up the majority of these things automatically. But for the time being it is up to us, the Strava community, to tidy it up the best we can which will also result in much more accurate stats in VeloViewer.
VAM and Relative Power – what’s that all about then?
Have you ever wondered what the VAM and Relative Power values are on VeloViewer ? Basically these provide you with a good set of values with which you can compare your efforts between different Strava Segments (as long as they are categorised climbs).

