 When I meet VeloViewer users out and about, the enjoyment of ticking off VeloViewer Explorer Tiles is the most common feedback I get. Since I came up with the idea of Explorer Tiles back in 2015 1000’s of VeloViewer users have been discovering new roads and trails close to where they live and further afield. A global heatmap of the ticked tiles has been on my to-do list since 2015 so it is embarrassing that it has taken so long to make it a reality! But wait no longer.
Put simply, VeloViewer Explorer Tiles are (roughly) 1km square grid covering the whole world. Ride/run/kayak/etc into a tile and your corresponding Strava activity, sync’ed with VeloViewer, will tick off that tile. More details about everything Explorer Tile related are available in these older posts:
- VeloViewer Explorer Score and Max Square
- Introducing the Explorer Cluster
- VeloViewer Chrome Extension for Strava Website
- Explorer Tile Calculation Updates
- Meet the Explorers
About the Global Heatmap
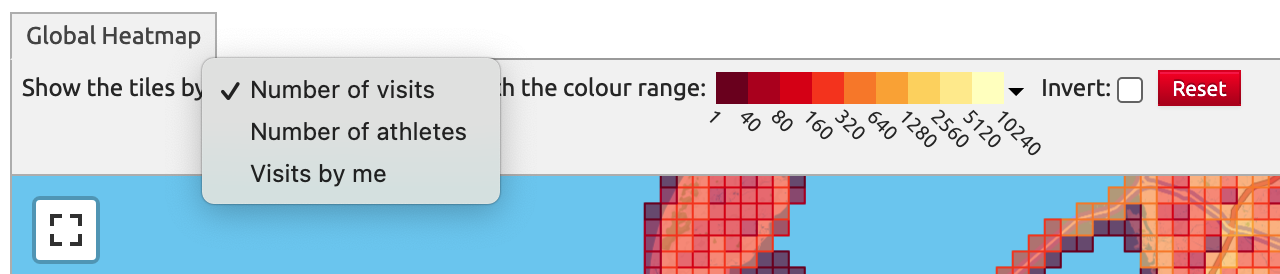
The Global HeatMap will colour the tiles across the world showing:
- Number of visits – total number of visits to each tile.
- Number of athletes – number of unique athletes that have visited each tile.
- Visits by me – your own personal tile heatmap.
With options to change the colours being used (“Invert” reverses the colours).
The scale for the colours will adjust automatically as you pan/zoom the map in order to account for tiles with higher visit numbers. If you pan/zoom into an area with lower visit numbers you can use the “Reset” button to force the scale to re-adjust based on the data in the current view.
If you Zoom out too far then the heatmap is hidden as it would cook your browser trying to display that much information! If you press the button just above the Zoom buttons it will zoom you back to the top level zoom that has the heatmap displayed.
Whose data is shown?
The data shown in the Heatmap is made up from VeloViewer PRO users who have opted-in to make their data public on their Update page Options. Tiles from their private activities are not included. Tiles of users who don’t make their VeloViewer data public are not included in the heatmap. The tile stats are cached for 24 hours so it might take a day for data to include or remove your stats if you change your privacy options.
Restrictions for non-Strava Premium users
Strava’s remarkably fantastic Global Heatmap is a wonderful resource which I often use to scout out lesser ridden roads/trails pre-holiday as well as just simply enjoying its artistic qualities. The full version of Strava’s heatmap requires a Strava Premium subscription and as with all functionality in VeloViewer I work closely with Strava to make sure I honour the T’s & C’s of using the Strava API with regard to not replicating Premium functionality and providing that functionality to non Premium users. Although the VeloViewer Explorer Tile heatmap is different to the Strava Heatmap in how it works it overlaps enough to require some restrictions.
Around 90% of VeloViewer PRO users are already Strava Premium users so for those people you will see the full glory of the VeloViewer Explorer Tile Heatmap. For those of you that aren’t then you will see a simplified version of the heatmap that groups the counts into three buckets/colours.
For those of you that aren’t already signed up to Strava Premium I have a promo that will give you a 60 day free Strava Premium trial (Ts&Cs apply) in order to try out all of that goodness as well as the additional functionality available in VeloViewer as a result.
Future plans
My plans are to incorporate the existing and additional Explorer related stats and charts into this page along with the leaderboards to give a single location for all of your Explorer needs.
I’m not planning on showing links to individual athletes or activities due to privacy concerns. If you want to find out who has ticked a particularly awkward tile and how they did it then click on the tile, copy the x,y number from the popup and then post a question in the discussion section of the Ride Every Tile Strava club. Getting involved in the excellent Explorer community is part of the fun of it.
Keith says:
Found some squares only visited by myself. I claim KoS (King of Square.) 🙂
Martin says:
I like the KoS idea! Though maybe something less gender specific. An award for the first person to claim a tile, and the person with the most activities?
Big question – which tiles have been visited the most?
Guy says:
I think most recent visitor would be better. My group often talk about how it’s a shame how over time more and more Strava segments go out of reach for the average athlete. Anyone can be the most recent if they visit a tile, and it won’t inflate over time.
Ben Lowe says:
I can potentially pull up stats for a specific tile in terms of who has visited it the most. Most recent visit will be trickier just because I’ve not been storing the activity date against tile visits (trying to limit how much data is stored), adding it in now will be tricky as there is already so much data. I will have to think some more about this one.
Elmar Hogenboom says:
I love the idea for a stat on how many tiles I am (currently) the only one to have visited, and how many tiles I was the first one to visit. Not so much interested in the leaderboard for these, as it favors areas with few VV’ers rather than necessarily difficult tiles. But for personal use, yes please!
Adrian Simpson says:
What a great feature. I currently keep my profile private but would like to be able to share my tile data. I wonder if there’s any future plans to allow more granular privacy settings. eg share access to route heatmap but not link to individual rides from it or hide the heatmap in selected tiles.
The tile heatmap seems to already have an extra level of privacy built in by removing the possibility of seeing who has visited a tile and so I would have no issue sharing my data in it.
Ben Lowe says:
Opting in to include your (anonymised) data in the Explorer Heatmap while keeping the rest of your data as private is certainly doable. If you have activities which are fully private on Strava then I wouldn’t include tiles from those. I’ll add it to the to-do list.
Adrian Simpson says:
Thanks Ben. There’s a number of squares in my cluster which aren’t currently on the heatmap so it will be nice to be able to share.
I may be getting a little greedy by adding more requests but how about giving an option to see your unique squares and possibly a variation of the Veloviewer Score based on your 100 rarest squares?
Ben Lowe says:
I certainly like the idea of counting/highlighting tiles that only you have visited. I would also like some sort of score but someone living in a low-VeloViewer-user area would then get loads of unique tiles and would therefore lead the way. The value for each tile would need to be worked out by the number of visits to its surrounding tiles so a rarely visited tile on the edge of Amsterdam would have a far higher value than a similarly unvisited tile in the middle of the Australian outback.
Adrian Simpson says:
I suspect whatever the formula is it will always benefit one region over another in the same way that The Veloviewer Score does.
I agree that it makes more sense to benefit those riding in congested areas as it’s more competitive that way, however I think that the number of athletes who are active in a region is more important than the number who have been very close to a square. This rewards people who go further into the hills rather than just nibbling at the edges.
A square’s score could be something like (1-(S/M))
Where S is the atheletes visiting the square and M is the maximum number of athletes visiting any square within a defined radius of squares.
In my mind this works well in mountainous regions where the number of visits tends to drop off as you approach the difficult regions, however it’s a little weaker on the coast where there tends to be more of a cliff edge drop in the number of visits.
I suppose you could equally well consider all surrounding squares but increase the size of the area being considered.
Andy says:
Nice – I’m enjoying exploring! Not sure the algorithm is quite right, or my understanding is wrong… while viewing Number of visits, if I click a square in my local town – 216 visits by one athlete (I find it very suprising I’m the only V’Viewer in the area). If I change to visits by me, I get 249 for the same square, which is inconsistent with the previous stat.
Ben Lowe says:
It depends if your data is set to public in VeloViewer or not. If not, then your tile stats won’t be included in the global heatmap data. The global heatmap data is then cached on the servers and is currently being refreshed every few days. I’ll be bringing that down to every day but just watching the impact of the refreshing on the performance of the servers/DB.
Likewise, there might only be one VeloViewer in your area that has opted in to make their data public,
If you have been public for a while then email me with a link to your Summary page and I can take a look.
J says:
It looks like activities on Pause that draw the straight connection line also collect tiles? Very much doubt the Pentland Firth Crossing
Ben Lowe says:
No, it’ll only tick tiles if there was a recording going on. More likely that someone was recording while on a boat/ferry or could even have been from a kayak trip.
lars says:
Loving it and happy to support such cool projects.
Still I am wondering if the calc is 100% accurate 😉
e.g. tilte 8712 5592 was visited by myself and the ride is not set as private, but still it only shows 0 visitors.
Anyways! Thanks a lot for creating, running and maintaining vv
Ben Lowe says:
If you want your tile ticking to appear in the Global Heatmap you need to head to your Update page, expand the Options section and check the option “Share my data with anyone”. This means that your public Strava data will then be visible to any other user on VeloViewer if they have the link. And it will then combine your ticked tiles into the heatmap.
yellow jack says:
Firstly let me say I “get” the privacy angle. I really do.
But it doesn’t mean I miss the ability to click onto individual activities from the tile map any less. That was especially useful when looking for ways into “difficult” and “impossible” tiles. At least you could trace the activity that claimed the tile and work out if you’d missed something on the ground, or perhaps changes to fences, gates, etc had put tiles out of reach. And obviously commenting on Strava you could always ask the rider as a last resort. All that has gone now, though. And it makes Strava/VeloViewer feel like less of a “community” too. It’s not just the changes to VV either. Strava started eroding the community feel (for me) when they wholesale changed the default on privacy settings and effectively killed off the ‘FlyBy’ feature overnight. That was something I enjoyed a lot. Everything from apologising for not “waving back” to meeting other riders and making “real life” friends.
But I see the flipside of that too. Blokes perving on female riders, folk stalking each other (I upset someone once by nabbing one of their KOMs – their reaction was to go out and target dozens of mine where the only purpose of their whole ride was to find and take “my” KOMs, but in the end we met up and rode together and he seemed OK. He even bought me coffee and cake!) And with the online world becoming increasingly aware of privacy issues it must be difficult to strike a balance and stay within the “rules”. Especially if you are interpreting and displaying data from a third party.
What more is there to say. I see why things have had to change, but don’t enjoy what those changes have done to the “tiling community spirit”. I’ll continue to subscribe, though. Now that I’m hooked on tile ticking I don’t think there’s any escape for me!
Ben Lowe says:
I completely understand both sides of it too. I’m thinking of adding an option where users can choose to let their activities and profile links appear in tiles should they be happy to expose this. It would need to be an opt-in though but should be easily doable. Those who are properly into the tiling thing (and therefore most likely those who have ticked those tricky tiles) would be happy opting in for that.
Jonas says:
I really like what you have done with veloviewer.
If I could wish for one thing, it would be to have a more fine granular privacy control. I am mostly interested in tiles and that’s what I would like to share and see from other riders. I don’t want to show my half-public (for strava subscribers) activities to the internet.
As I understand, people who went private (like some of the most active tilers) did that because they didn’t want to share the activities. Showing just the visited tiles (like in the heatmap, but just for one rider) is much less sensitive and my guess is, that probably most would be comfortable sharing it.
I completely understand that time is limited. That’s just my longterm wish. Christmas comes soon 🙂
Ben Lowe says:
Hi Jonas, I’ve had similar feedback from a couple of others. I would like to add two more options:
1. Give the ability to opt-in to have your Explorer tiles included in the Global Heatmap even if you have all the rest of your data private in VeloViewer.
2. Give the ability to opt-in to have links to your athlete and activities from the tiles in the Global Heatmap (would require the user to already have their data in VeloViewer set to public)
In all cases activities that are set to private will never be visible or linked in VeloViewer to other users and also won’t have their tiles included in the Global Heatmap whatever options they have chosen.
Kevin says:
Is this the “share your data with anyone” box that needs to be ticked in order to contribute?
Ben Lowe says:
Yep, that’s the one (in the Options section of the Update page).
Alex says:
Hi Ben,
first let me say thats a nice and great feature you developed here.
Before it was always possible to download a KML File with all no visited tiles, will there again be such export function?
I’m planning my routes this way, exporting here in Veloviewer, importing in another tool and planning there and I loved it that way, because that’s a open streetmap spezialized on streets with very low traffic normal traffic or heavy traffic, lots of features for biking.
Maybe it is hided anyway and I’m kinda blind 😉
Thx and greets from Germany
Alex
Ben Lowe says:
Hi Alex, Yes, the KML export for unvisited tiles is still available. Head to your Activities page and open the map view. Pan/Zoom the map to the area you wish to get the export and then press the map settings (cog) button in the top right of the map. In there you’ll find buttons to download the KML files for both visited and unvisited tiles in that area.
Cees says:
So we can no longer see rankings per country anywhere?
Ben Lowe says:
Not at the moment. I replied to this same question somewhere else but I can’t find it now… The tricky thing is knowing which country to put people down to as Strava doesn’t provide a reliable value via their API. I could use the centre point of the Max Square but that might not work for everyone if they close to a border. But then if you have a square that spans two or more countries then how should that be displayed in a country leaderboard? I’m currently thinking through the various options around this in a way that’ll work effectively for as many people as possible.
Peter says:
Rankings per country would be low on my wish list to be honest. The most addictive leaderboards were the ones on rakietowa.org They got updated once a week, showing you not only how many tiles you added to your cluster (I already know that), but also how busy “the competition” was last week 🙂
And no matter wat cool data a leaderboard may hold, it is only interesting if everyone is on it. In practical terms, at least all the members of the “Ride Every Tile” Strava club (regardless of whether they are Strava Free/Premium or Veloviewer Free/Pro subscriber).
For me this new heatmap is “looked at it only once” eye candy because of all the filtering you described in “Whose data is shown”. There’s no “feel good” in seeing you’re the only one who bagged a square (or are one of very few) when you _know_ the data is incomplete. Number of visitors of a 2.3 sq. km area is so high level and abstract that I just don’t understand all the caveats (and I tend to be quite privacy aware, goes with being an IT professional I guess).
Anyway, looking forward to having an Explorer leaderboard on Veloviewer!
Ben Lowe says:
Hi Peter. Thanks for your thoughts. I do already have an Explorer leaderboard for tiles, max square and max cluster https://veloviewer.com/leaderboard/y/0/t/explm/at/-/c/0 but like you say, being able to see who has been the busiest over the last week would be a good addition. The data is currently stored to provide this but I’m already looking at storing progress over time for Explorer stats which would then be able to be used in a leaderboard of some kind.
It will always only be able to show data for those people who opt-in to be included. Plenty of people who enjoy using the Explorer functionality but want to keep their data/activity private.
Paul says:
Did you do any more thinking on a country leaderboard Ben? Looking at the global heatmap for New Zealand its pretty much as I expected that the geography prevents anyone getting a massive cluster. My max cluster is 131 which I suspect would be relatively high ranking for NZ but puts me barely above the lower quartile internationally – I could run/ride full time for the rest of my life and never get to 28,000 so the international leaderboard is pretty irrelevant to me.
Ben Lowe says:
I’ve got something in the works along this line although it won’t be covering the whole world to start with. Tricky thing with filtering leaderboard based on a country is that (apart from not having a very reliable way of knowing which country a person is related to) is dealing with people whose exploring spans multiple countries or if they have moved countries and have a massive square where they used to live. Hard to span a separate country with a max square based in New Zealand but for those in small, European countries they often spam multiple neighbouring countries.
Péter says:
Hey Ben,
Did you have any luck progressing with the country leaderboard feature? I understand the issues with matching users to countries, but how about a super simple solution to make a guess but allow users to change which country they feel like competing in?
Anyway, thanks for all the good work during the years, I think tile exploring is one of the longest hobbies I kept.
Ben Lowe says:
No progress yet. It is just a really tricky thing to make robust. Squares spanning multiple countries, people moving house and having their biggest square in a different location to where they live (so not able to select their new location without messing things up) and numerous other scenarios. If I feel adding half a solution will result in a bunch of support issues that I can’t really deal with then it isn’t worth building the half solution in the first place.
eff says:
I thought one of the sites (Veloviewer? RideEveryTile?) used to show you the actual list of rides that went through a tile. Not very useful for popular tiles but for lightly visited tiles it was useful to see what path(s) someone had taken and in a case or two it pointed out that maybe someone was on a powerboat rather than a human powered craft. These seem to have disappeared, maybe this is a feature you could add if you’ve stored all the ride data.
Ben Lowe says:
This was something that was provided by RideEveryTile but due to privacy/GDPR concerns this isn’t available. I’m looking into allowing people to opt-in to allowing their activities to be discovered in this way but it won’t be something that is enabled on user’s data by default.
matus says:
Hi Ben, is there a reason why do the tiles around Vienna, Austria look like no one has visited them? It looks like a bug to me. Thanks
Ben Lowe says:
Hmmm, when I look at Vienna (with “Number of visits” selected) it is lit up like a hot thing. Can you email me with what you are seeing?
Martin says:
I love the idea of the explorer tiles and especially the “max square” and “max cluster”.
Wouldn’t it be nice to combine that with an “how often passed” counter as a third dimension?
So ist will become a “max cube”? 🙂
Ben Lowe says:
You’ve got your Explorer heatmap (available here: https://veloviewer.com/explorer) which does reflect the number of visits to each tile. I’ll have to see how process intensive it is to work out a max cube! I always thought that having some sort of 3d view of tile towers based on the number of visits would be cool. Not sure I want to try and render it on the site though! I might try to export a kml file with extruded polygons and then view it in Google Earth.
Raul says:
Can someone give me a link on how to use a kml file in designing routes? Cannot find it.
it looked like some Extensions were going to help me but none of them really works. Brouter, Squadrats, Statshunters, Garmin. For different reasons. I don’t work with Strava and find the costs too high for just this…..
Min says:
Some of the tiles I have visited do not show up as having been visited at all. Fixes?
Ben Lowe says:
Hi. I’ve sent you an email to provide me with some specific examples so I can take a look. Ben
Colin Cadden says:
Yep, there are many squares in my locale that are incorrectly showing as “not visited”.
Ben Lowe says:
Hi Colin. It will only show tiles visited from people that have opt’ed in to make their public data available for everyone to view within VeloViewer. So activities that are public in Strava and also chosen to make their VeloViewer data visible to the public. If you’ve got specific tiles that you that you think should be showing as ticked in the global heat map (perhaps by your own visits, and you have made your data public in VV) then please get in touch via email with the details of the area concerned and an example activity so I can take a look.
Tarja Barnes says:
Hi Ben,
I am new to to explorer tiles so this might have already been discussed.
While collecting tiles I keep thinking that percentage of the tiles covered by country or even state/region/county would be really interesting. Some tiles are of course impossible or very difficult and in addition, having a percentage coverage leaderboard would also be interesting as could see how others are progressing in exploring each country.
Ben Lowe says:
Hi Tarja. this is certainly something of interest and I’ve got some code that does 90% of this already. That last 10% has proved very difficult and it is currently on hold. For some countries a % covered is really interesting (e.g. Belgium) but for others it is pretty meaningless (e.g. Canada). I’ve looked into county level % here in the UK which is more useful for most of is than the UK as a whole. I may well revisit this area in the future but unfortunately it is parked for the time being.
Tarja Barnes says:
Thanks Ben,
Hopefully the last 10% sorts itself out soon