 I’ve seen on the Strava Customer Support site lots of people asking to be able to show off all the challenges that they have completed. As it stands I don’t know which of the challenges you have or have not signed up for but I can quite easily calculate how you would have done if you had. So here it is: a trophy cabinet of all the challenges you have completed and those that you didn’t quite achieve (whether you were trying or not)! Of course this is only currently available for cycle challenges, not running ones.
Month: February 2013
The Climbs of Stage 2 of the 2014 Tour de France – Part 1
 Stage 1 may well have been one for the sprinters but stage 2 is being heralded as a proper, Yorkshire, Northern Classic of a stage and that means plenty of climbs. The route takes in almost 4000m of climbing along its 208km starting in North Yorkshire, passing through West Yorkshire, dipping its toe ever so slightly into Derbyshire before the grand finale in South Yorkshire. There are so many climbs that I’m splitting them up over 2 blog posts! In this post we’ll cover the route from the start at York Racecourse up to the climb of Cragg Vale and here you will find Part 2 with all the remaining climbs all the way to Sheffield.
The Climbs and Finish of Stage 1 of the 2014 Tour de France
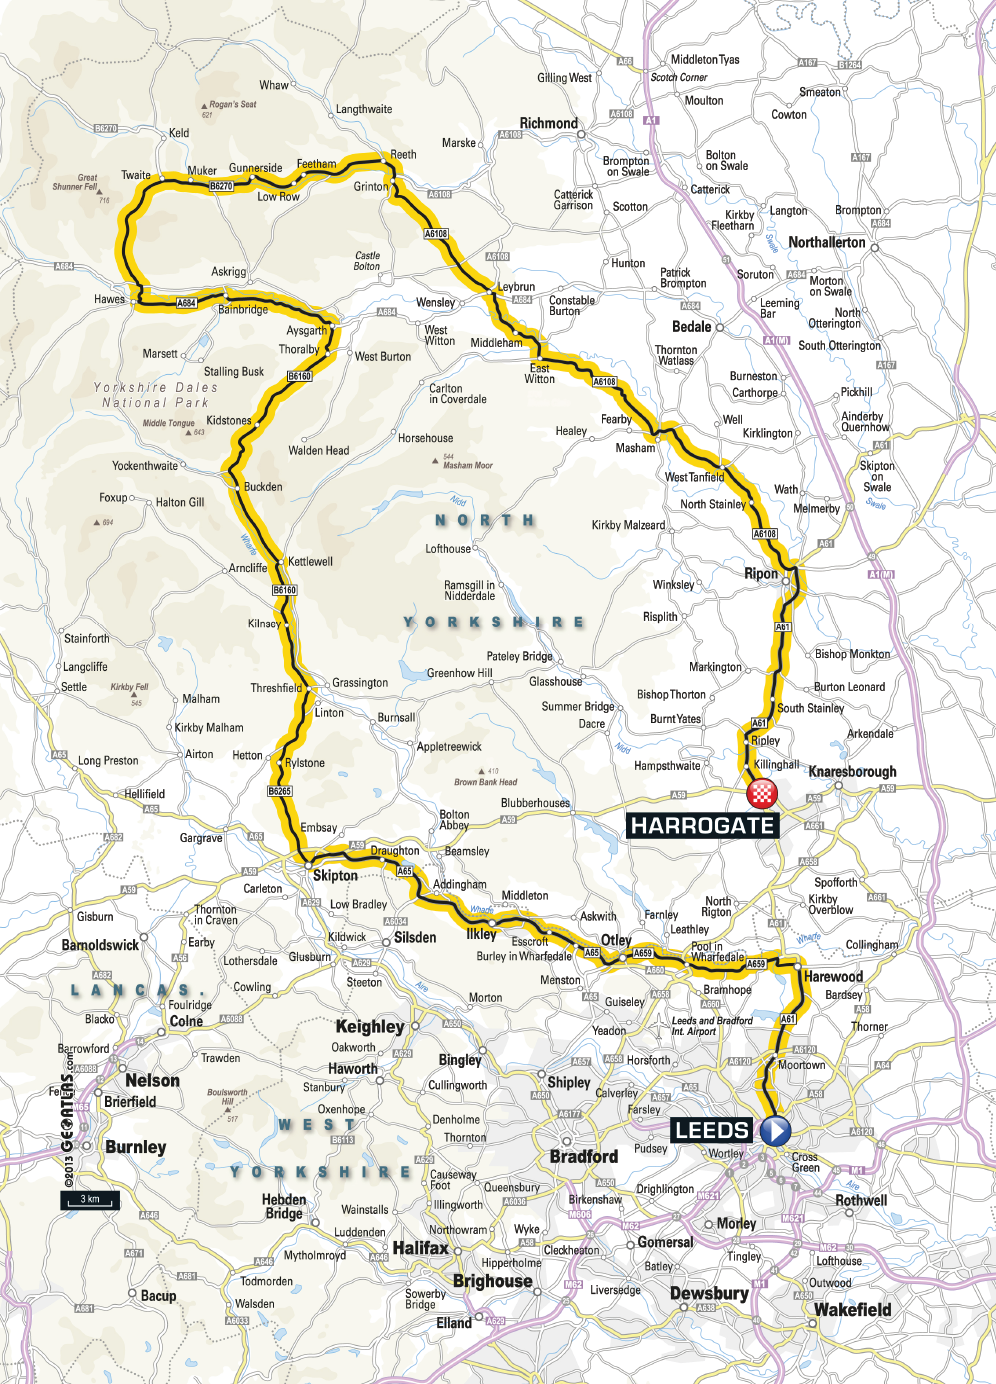
 Stage 1 of the 2014 Tour de France will travel from Leeds Town Hall to the spa town (and home of Yorkshire Tea) of Harrogate in just over 200 km (around 2800 m of climbing) and a sprint finish (and a British Yellow Jersey?) is anticipated. But this stage is by no means flat and if you are planning on riding the stage then you might be interested in knowing what you are letting yourself in for.
41 mph? The Evidence Against the Sunday Times Article
 Yesterday The Sunday Times newspaper (UK) had an article on page 5 of the main section entitled “40mph city cyclists defy speed limits” (in the paper) “City cyclists turn roads into racetracks” (on the website) written by Nicholas Hellen and Georgia Graham which repeatedly refers to a Segment in London where the average speed of the fastest riders is 41 mph. I was contacted by Georgia last Thursday and spoke at length to Nicholas about Strava and how it works and particularly about how you can’t trust the timings (and hence speed) of short segments. But from the beginning of the conversation it was very clear what their angle was going to be and basically wanted me (or someone) to be able to quote saying that Strava encourages me to break the law (speeding (which I pointed out to him isn’t actually breaking the law) and jumping red lights) in built up areas. It doesn’t and I don’t. In this post I’ll do my best to explain why that 41 mph should actually be more like 31 mph.
Holme Moss Climb (Tour de France Stage 2, 2014)
 Holme Moss is a bit of a classic around these parts, particularly because it usually requires a fairly long loop and another major climb to get back home again, but also because it is one of the highest roads in the area and at 524m will be the
 highest 2nd highest (Buttertubs Pass is 526m!) point visited by the 2014 Tour de France during its stay in England. Never ridiculously steep, the climb puts its efforts into psyching you out by laying out the snaking finale in front of you with the majority of the climb still remaining. The Mont Ventoux’esque transmitter tower that sits at the summit of the climb is so unmistakably apparent it is impossible ignore what’s in store.
(photo: @paterson_alan)
Full Screen Maps and Panoramio Integration
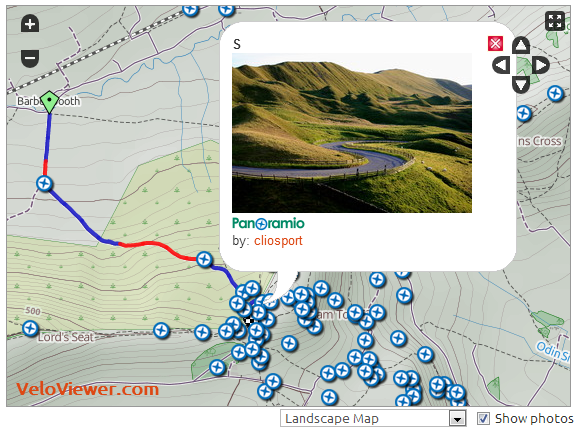
 Two very neat additions have been added to the Segment Details and Ride Details‘ maps: the option to go full screen and the option to overlay photos from Panoramio. Now your maps can go HUGE while you review your rides and check out everyone else’s pictures to see what you missed along the route, saves having to stop and take any yourself doesn’t it!