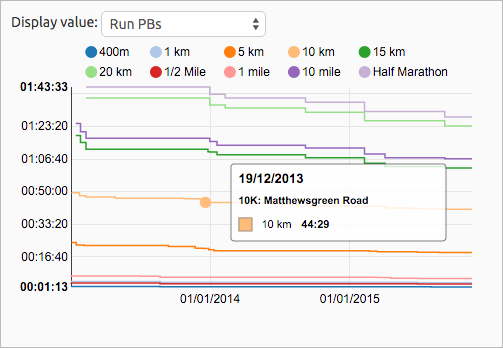
 A user recently requested on the VeloViewer Run club in Strava to be able to see an evolution of their running best times over the years, so here it is. With the filtering already available on your Summary page you can also just select a single year to easily view your season bests for each distance too.
Month: November 2015
Tour de France 2016 Stage 18 – The Final, Mountain Timetrial
The final timetrial of the 2016 Tour de France comes with just 2 more “proper” stages remaining and will provide a great opportunity for the final GC positons to be decided although the next day’s summit finish at Le Bettex and stage 21’s final climb of the Joux Plane. The timetrial itself takes in the classic climb from Domancy (tackled 20 times in the 1980 World Champs), up through Combloux before a couple of steep ramps and a short descent to the finish in Megève.
Introducing VeloViewer PRO✚
Who doesn’t want more power? Now with VeloViewer PRO✚ membership you get all the bits you already know and love but with no “refresh limits” on your Update and Rivals page….all for £20 a year! With PRO✚ there is no need to wait before you can check all of your segment placings, find any newly created segments and see how your Rivals are fairing. It also gives you the opportunity to show your extended support for the site by paying that little bit more than the standard PRO rate. NOTE: there are no changes to what is available to PRO users now or in the future as a result of this 🙂
Continue reading
VeloViewer PRO – one year in!
The 9th November 2015 will mark 1 year since the introduction of VeloViewer PRO and I would like to take this opportunity to thank everyone who has upgraded to PRO and helped to support the site over this last year (and prior to that). It has been an exciting time for me personally as it has allowed me to drop 2 days a week of the day job to focus on supporting and adding features to the site which hopefully you’ve all benefitted from. I’m really excited about both improving the existing functionality and working on new areas over the next 12 months and fingers crossed the PRO membership numbers will increase and I’ll be able to do a Ray Maker and turn VeloViewer into a full-time job!
Summary View of Heart Rate Zones, Power Zones (& now Pace Zones) and General Suffering
 Viewing your heart rate, pace zone and power zone distributions (i.e. how much time spent in each zone) along with Suffer Scores for individual activities is very straightforward, but only once we see that data represented over longer periods of time do we get a clearer view of how well our training has been going. On your VeloViewer Summary page each of these metrics can now be viewed with the distributions clearly displayed with the data grouped over whichever time period you need.