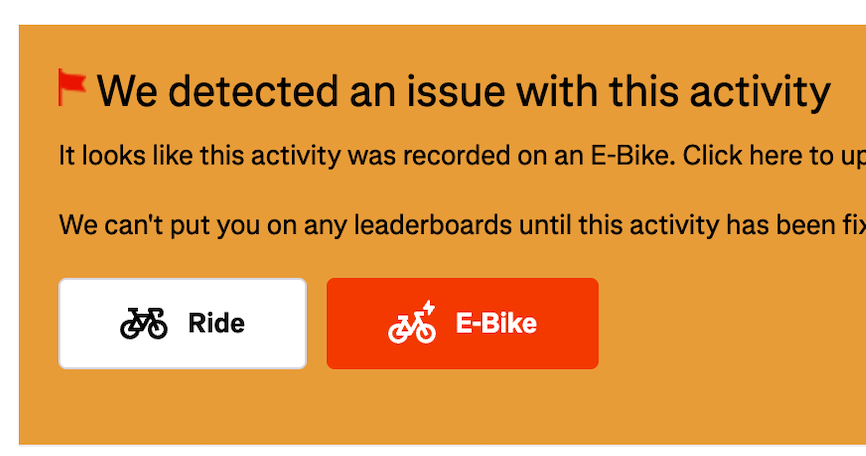
Introducing the Explorer Cluster (and configurable explorer visuals)

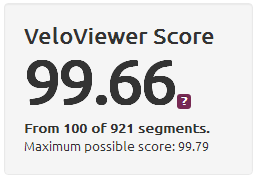
Since the introduction of the
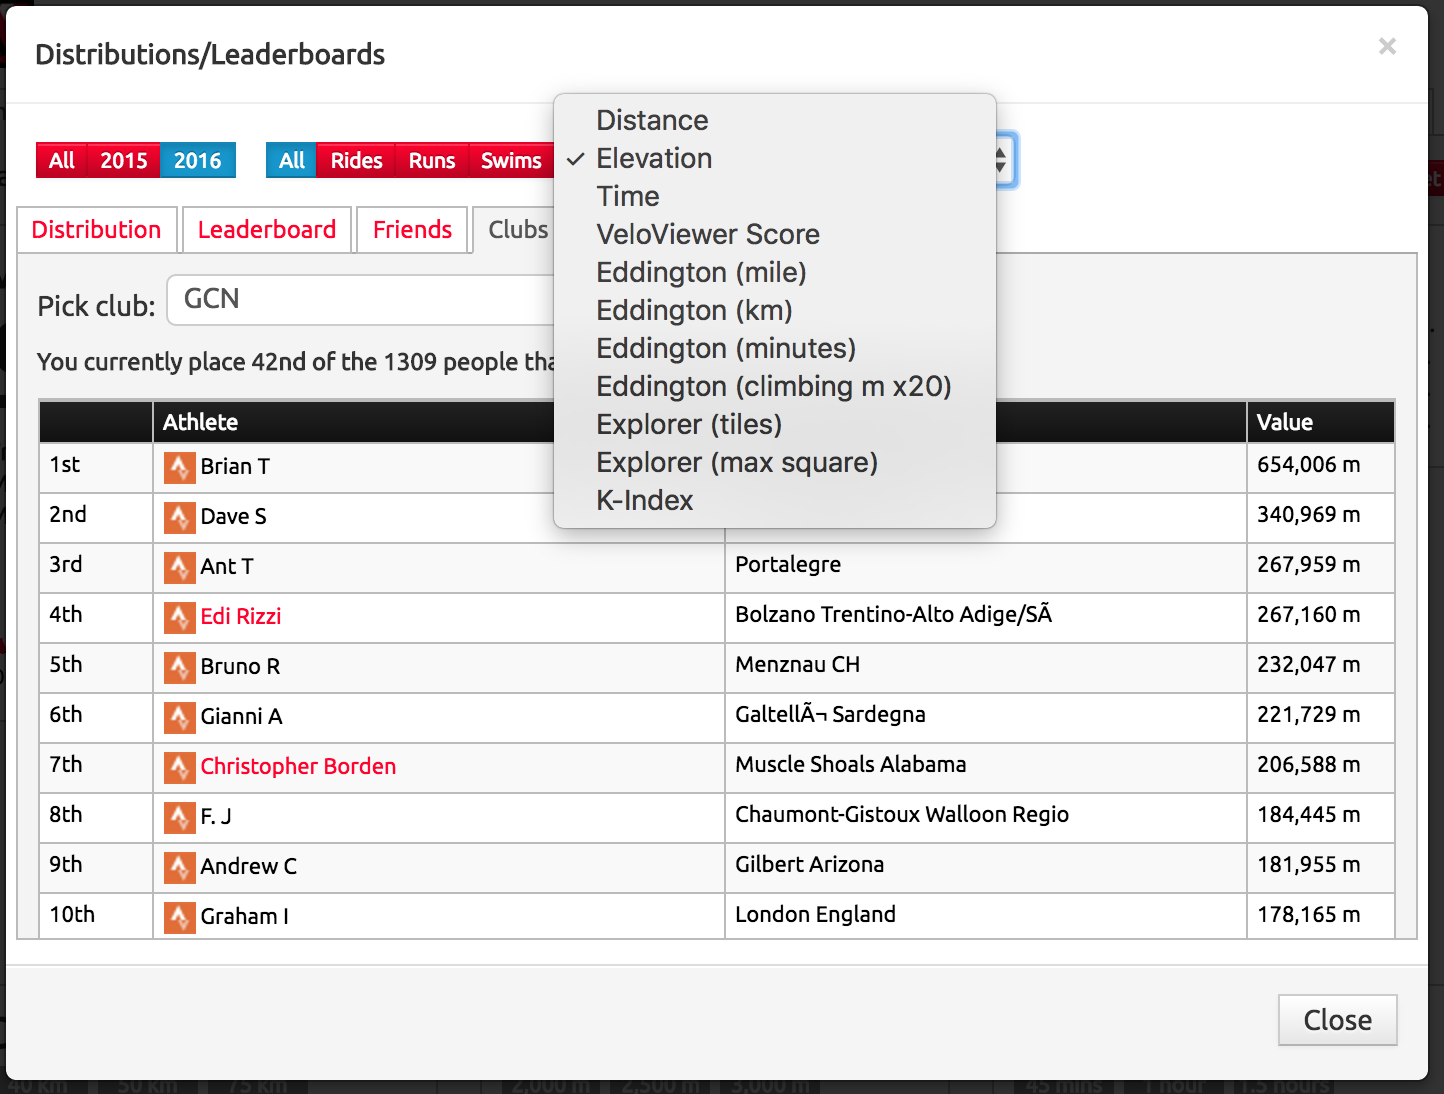
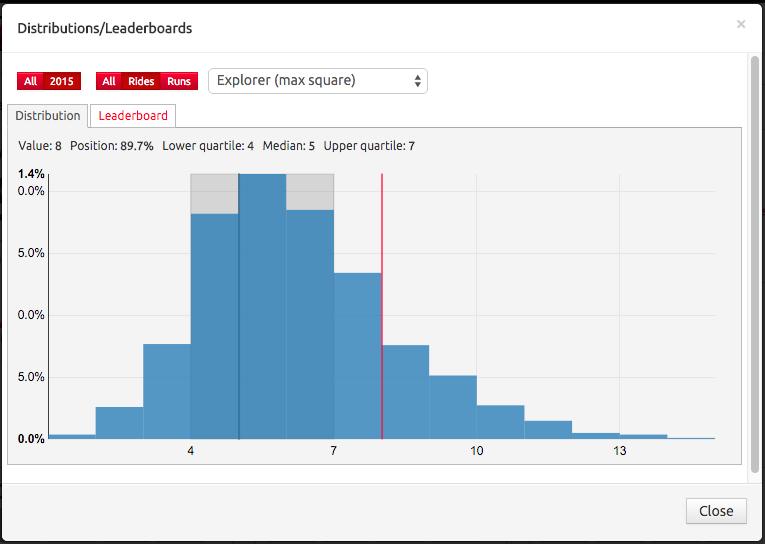
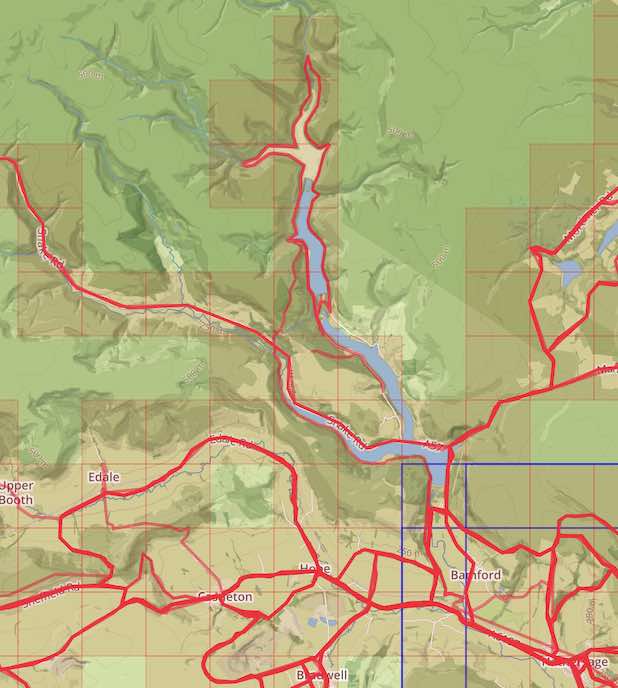
 Explorer Score and Explorer Max Square there have been requests for some sort of metric to represent the maximum number of connected Explorer tiles. The recent improvement in the calculation of completed Explorer tiles sparked a very active discussion which resulted in the refinement of the concept and the creation of the Explorer Cluster. The Explorer Max Square provides a hard-core challenge but can be tricky for people who live in geographically challenging areas or have key tiles which are completely inaccessible.  This is where the Explorer Cluster looks to provided a more level playing field.

Continue reading

Strava Club & Friend Yearly Distance/Elevation Leaderboards

Who in your Strava cycling/running/swimming club has put down the most distance or climbing over the year? VeloViewer’s yearly leaderboards for whole array of different metrics might be just the ticket to finding out.  Pick any of your Strava clubs or the list of people you follow to see year or all-time leaderboards for all of the key metrics.

Continue reading

VeloViewer Explorer Score and Max Square

The VeloViewer Explorer Score and more specifically the Explorer Max Square has acquired a bit of a cult following since its introduction to the site back in March 2015 despite me not having fully explaining what it is all about until now!  The Explorer Score rewards those people who explore new roads/trails rather doing the same old loops. Providing non-performance based motivations has always been one of the main goals of VeloViewer and this one really looks to tick that box.

Continue reading

Your 2015 VeloViewer/Strava Infographic

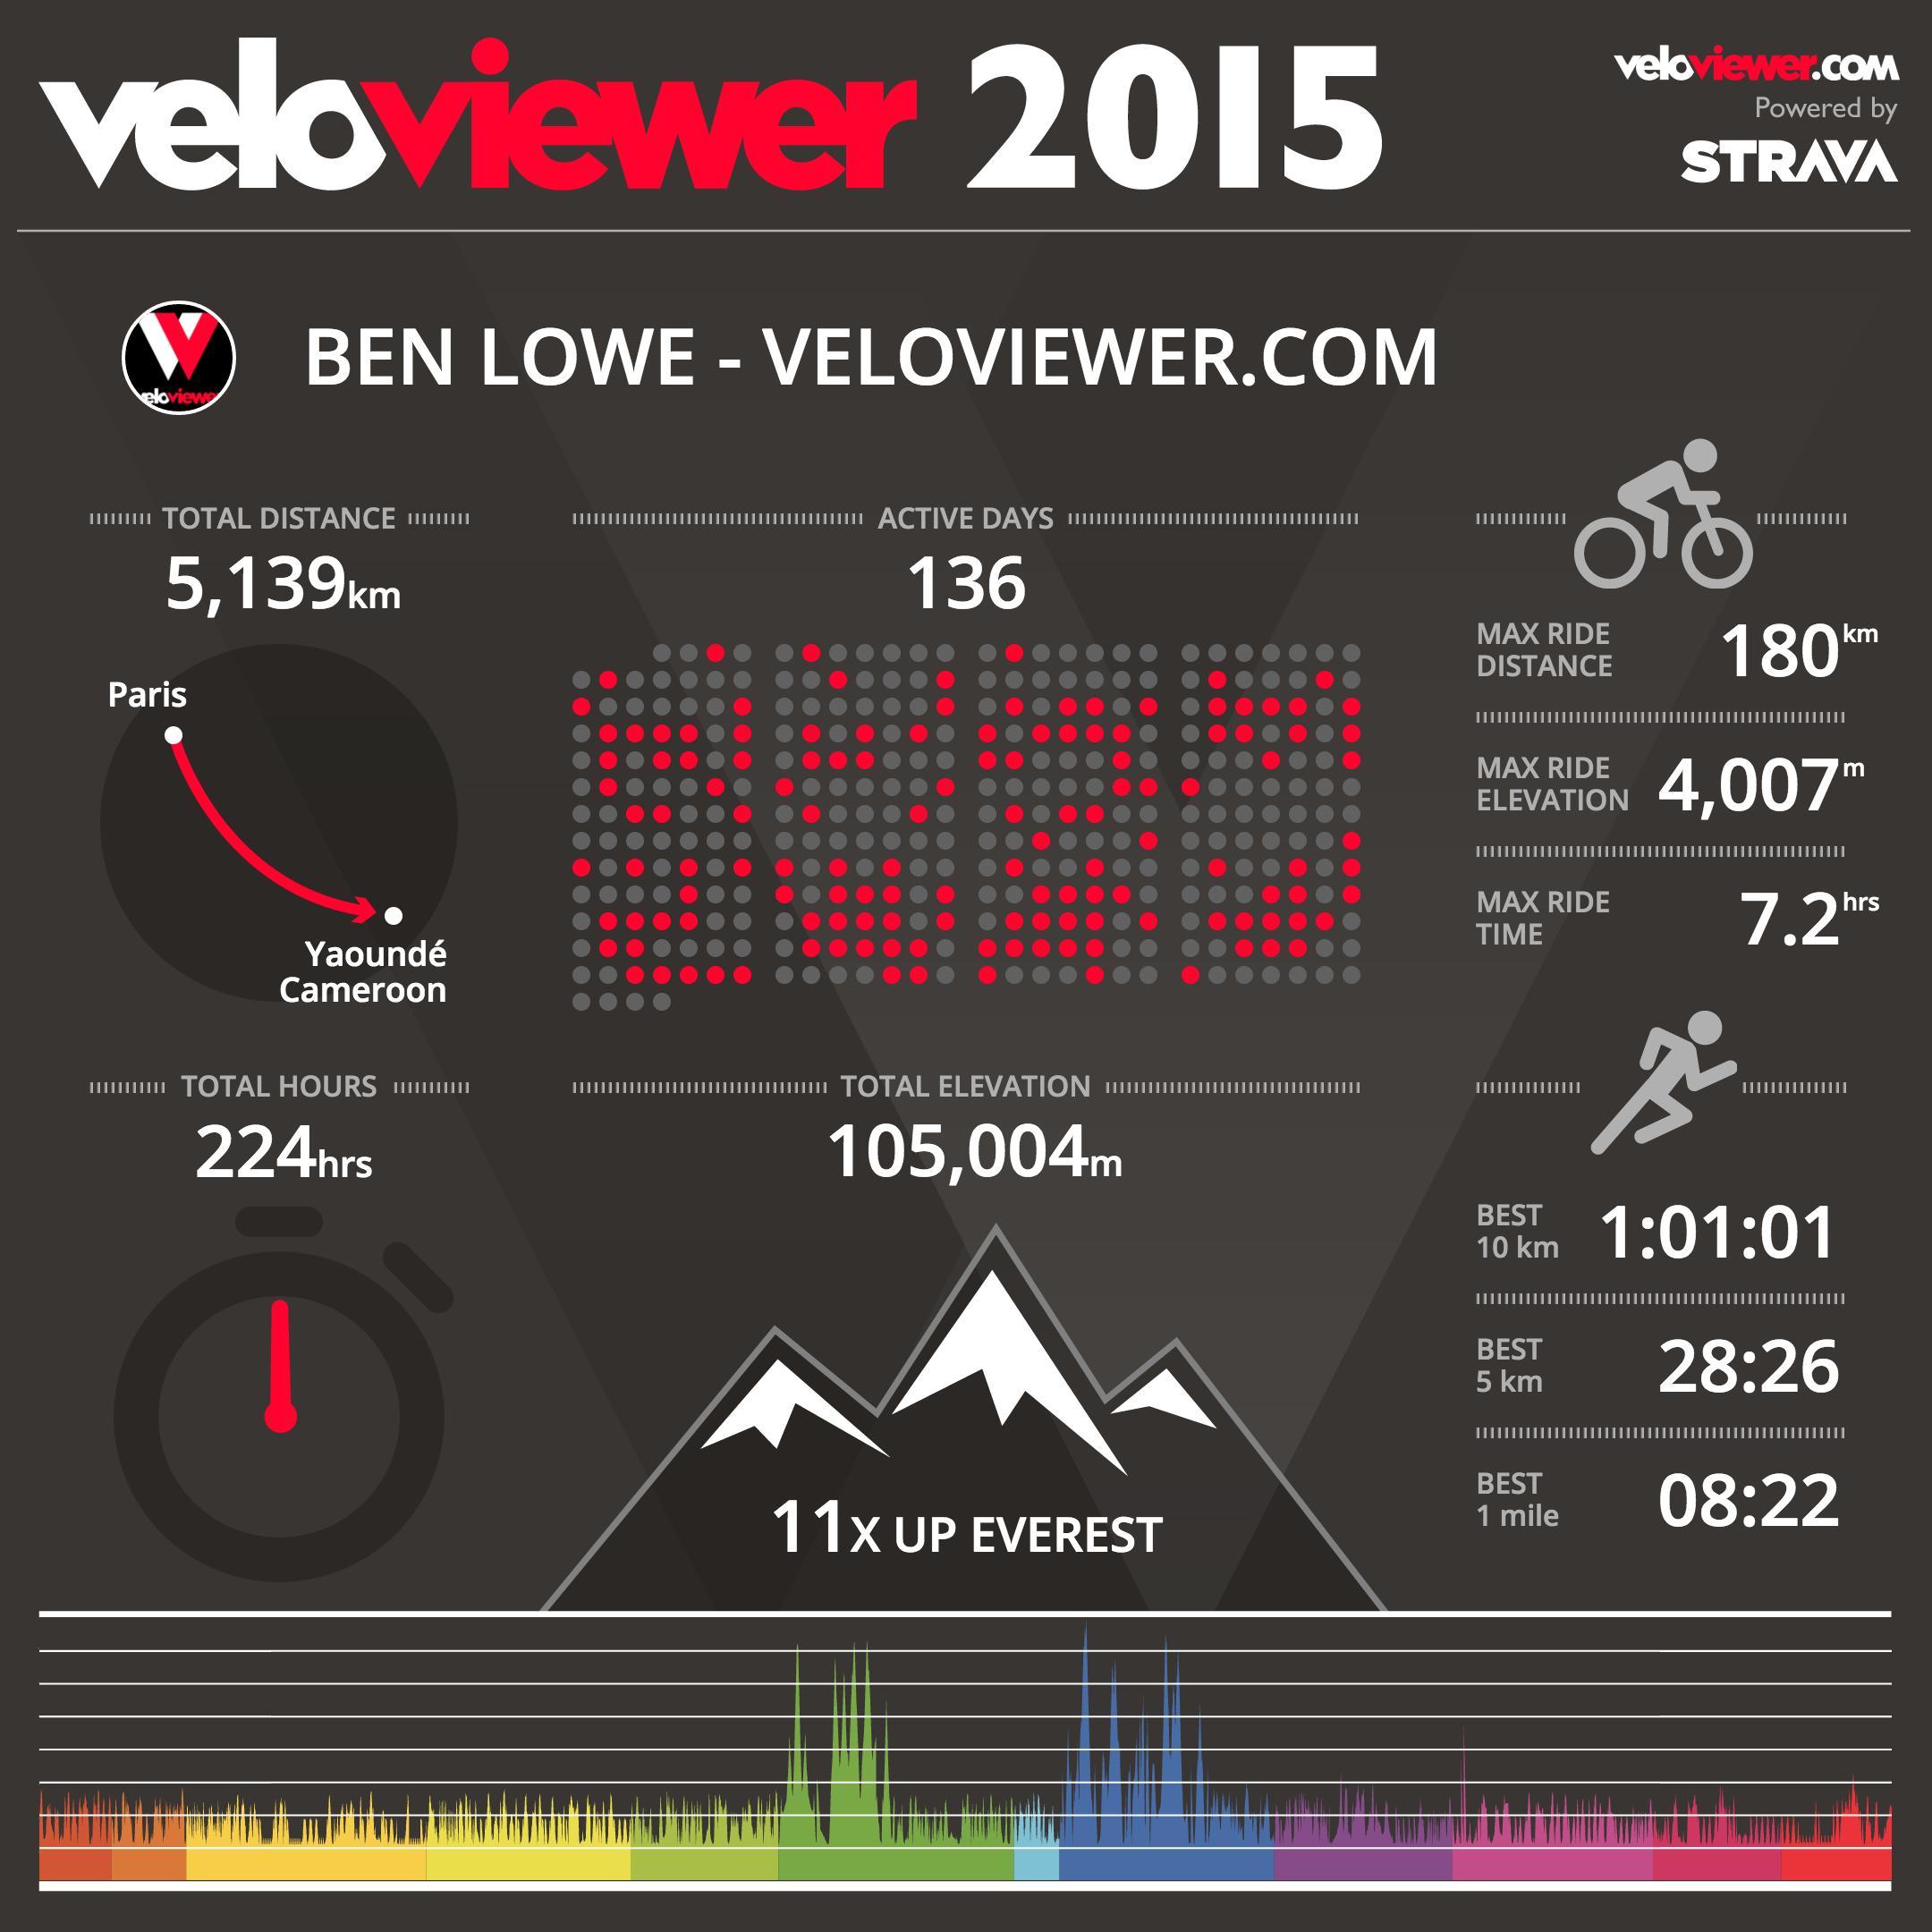
It is that time of the year when we can bask in the glory of our own epicness with (hopefully) huge distances explored, mountains conquered and PBs smashed making all of the saddle sores and blisters worthwhile.  Or perhaps a year of simply commuting to work or Park Runs with most likely more impressive results than my own!  Whatever your achievements this year VeloViewer has stepped up to provide you with a funky infographic that hopefully you’ll all share far and wide showing everyone what you’ve been up to.

Continue reading

Summary View of Heart Rate Zones, Power Zones (& now Pace Zones) and General Suffering

Viewing your heart rate, pace zone and power zone distributions (i.e. how much time spent in each zone) along with Suffer Scores for individual activities is very straightforward, but only once we see that data represented over longer periods of time do we get a clearer view of how well our training has been going.  On your VeloViewer Summary page each of these metrics can now be viewed with the distributions clearly displayed with the data grouped over whichever time period you need.

Continue reading

The Strava Challenges Trophy Cabinet Lives Again

Strava Challenges

It has taken some time for me to get round to reimplementing the Strava Challenge Trophy Cabinet that was a popular feature of the last version of VeloViewer but the wait is now over! On your VeloViewer Summary page you are now provided with a list of all the Strava Challenges that you have completed, fully or in part along with any current Challenges that are in progress.

Continue reading

VeloViewer Score – How Do You Measure Up?

VeloViewer ScoreThe VeloViewer Score is a composite measure providing a single value that represents your best Strava achievements.  This value can then be used to benchmark yourself against any other VeloViewer user around the world.  In this post I’ll explain how it is calculated and where your Score fits in against other VeloViewer users.

Continue reading

Position Score – the Column Formerly Known as Position Percentile

Segment StatsYour leaderboard positions on Strava segments can be a bit of a badge of honour but the significance of each of those positions can vary wildly. If you are 6th placed out of 3000 riders then that is pretty good going but 1st place out of just 2 riders is less so. In steps an suggestion from a forum to include a position percentile column and corresponding graphs, a few minutes later and the first incarnation of the position percentile appeared.

Continue reading