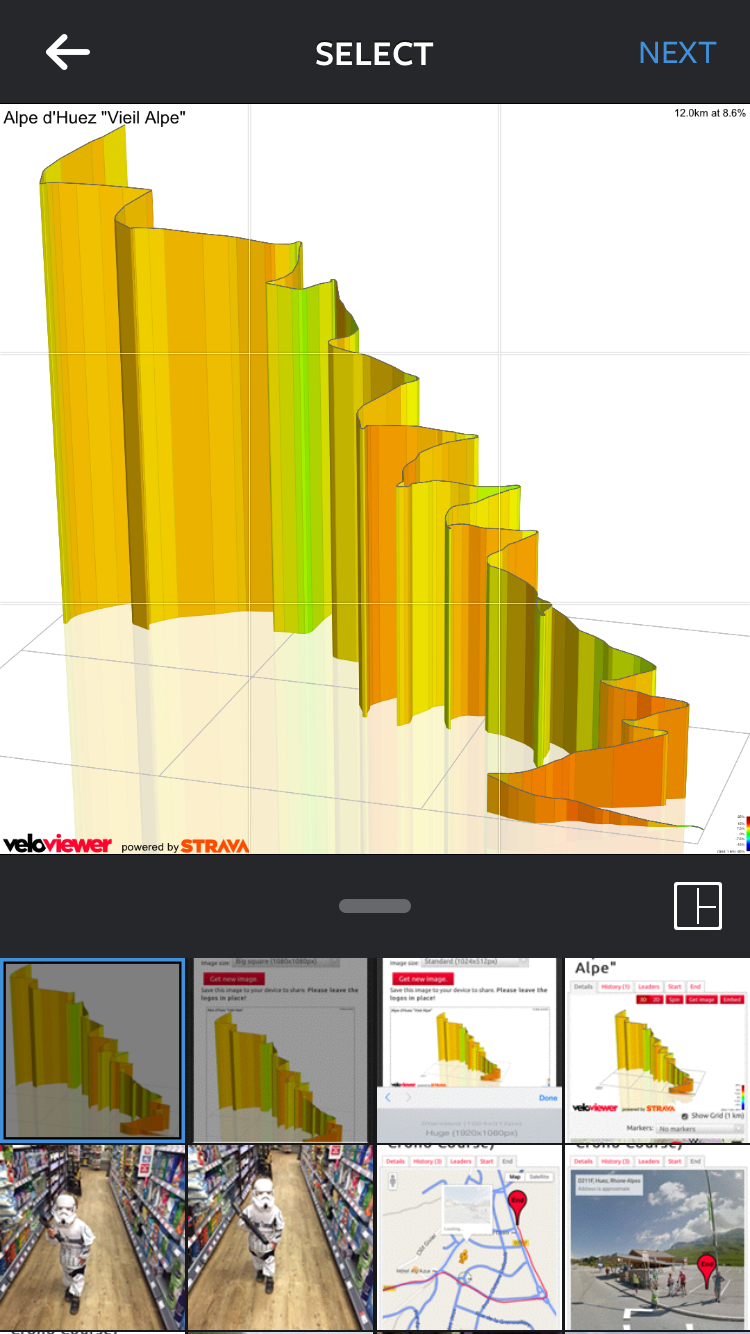
 Hopefully lots of you will have seen the 3D profile images being showcased on Eurosport throughout the Tour de France coverage this year. I have now massively improved the way you can get hold of your own 3D profile images of rides, runs or segments to make it much easier for you (as well as me) to attach to your Strava activities or share on social media from your phone, tablet or PC/Mac.
Tag: Segments
Getting your Power/Heart Rate FTP and Normalised Power from your Strava data
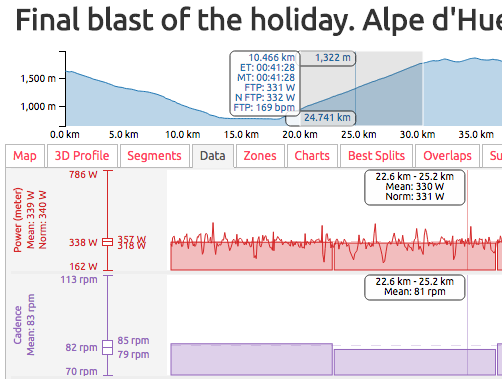 Finding your FTP (Functional Threshold Power/Performance) is a unavoidably painful experience but getting a number out the other end shouldn’t be, which is why I’ve tried to make that part of the process as simple and versatile as possible. Just sync your data from Strava over to VeloViewer and let VeloViewer do all the number crunching on your behalf. Instantly see your power, normalised power and heart rate based FTPs against all your segments or over any part of any of your activities including your best splits.
Continue reading
Updated Athlete Segment Comparison Page
 The athlete, segment comparison page on VeloViewer used to be limited to just allow you to compare your best efforts against other athletes who used VeloViewer. Well that is no longer the case! The updated version of the comparison page now allows you to compare yourself against any other athlete on Strava on your favourite segments.
Interactive 3D Elevation Profiles
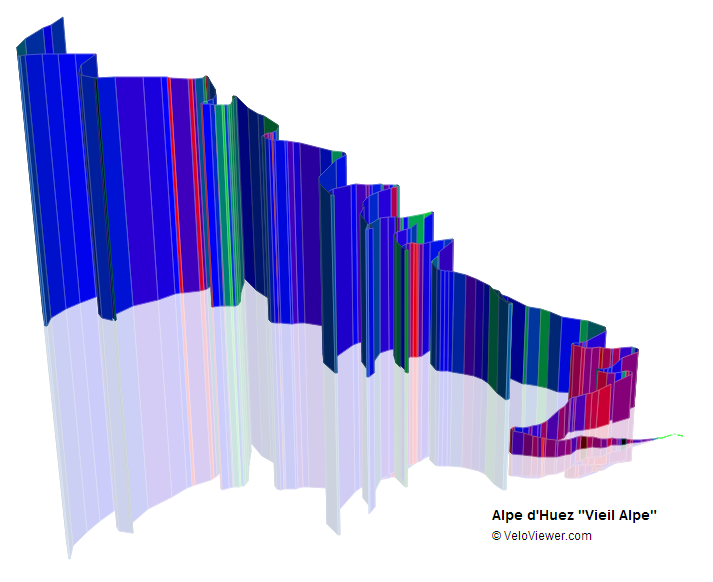 This is something I’d been wanting to do for ages and I’ve even surprised myself with how well they’ve turned out! The majority of elevation profiles you see around the cycling world look like they were drawn in the late 1990’s so it was time to bring them up to date and make the most of the latest technologies to allow you to interact with them.
Word/Tag Cloud your Strava Segments
 So what type of segments do you tend to ride? OK, this isn’t really going to tell you that perfectly but it might give you some indication. As you can see the segments around here in Sheffield tend to be either climbs or descents, but that’s why I live here! Check out your own Strava segment word cloud on your new Word Cloud page. Update: Now has Ride option too!
Number of Tries now in Segment List
 Not quite sure why I didn’t have this column in here from the start to be honest but its there now: the number of tries you’ve had on each segment, and of course you can order by it.
In order to populate the data for this column you must press the “Check for new segments” button on the Update page. Until then you will just see a list of question marks.
You will also see the number of tries in the History tab header on the Segment Details page.
VeloViewer Update Page
 If you are new to VeloViewer or just want to know a bit more about Update page then this is the page for you. Basically you can’t go far wrong following your nose but read on for more detailed instructions.
VeloViewer Mapping Options
 Seeing your rides and segments on maps is a complete no-brainer in terms of functionality for VeloViewer and the recent additions of Velo Flow and the Ride Details page along with the existing Segment Details page you now have many ways of viewing your rides. But what is the best map to display beneath your rides? Take your pick…
Introducing Velo Flow – animating Strava rides!
UPDATE – Due to changes in the Strava API increasing user’s data privacy VeloFlow is no longer able to run.
After coming across a great visualisation last week that animated GPS traces of staff commuting to Loughborough University I was inspired to try something similar with Strava rides and I’m very pleased with the result.
How-To videos now available.
Find out how to use Velo Flow here.
Position Score – the Column Formerly Known as Position Percentile
 Your leaderboard positions on Strava segments can be a bit of a badge of honour but the significance of each of those positions can vary wildly. If you are 6th placed out of 3000 riders then that is pretty good going but 1st place out of just 2 riders is less so. In steps an suggestion from a forum to include a position percentile column and corresponding graphs, a few minutes later and the first incarnation of the position percentile appeared.