 This is something I’d been wanting to do for ages and I’ve even surprised myself with how well they’ve turned out! The majority of elevation profiles you see around the cycling world look like they were drawn in the late 1990’s so it was time to bring them up to date and make the most of the latest technologies to allow you to interact with them.
On every VeloViewer segment page you will now see a “3D Profile” tab which will open up your very own interactive view of any Strava segment. Just click (or touch) and drag the image to see around and over the profile. Neat!
As with all the elevation based info from Strava, if the segment has bad data (i.e. not from a barometric GPS device) then the profile will probably look weird! I’ve done what I can to smooth it out but if it still look wonky then have a look to see if there is a duplicate segment that has better data.
Here’s some examples of some great roller-coaster segments. Post a comment below linking to the coolest profiles you come across.
Box Hill, UK

View Box Hill segment on VeloViewer to get interactive.
La Marmotte Sportive, France

View La Marmotte segment on VeloViewer to get interactive.
Holme Moss, UK
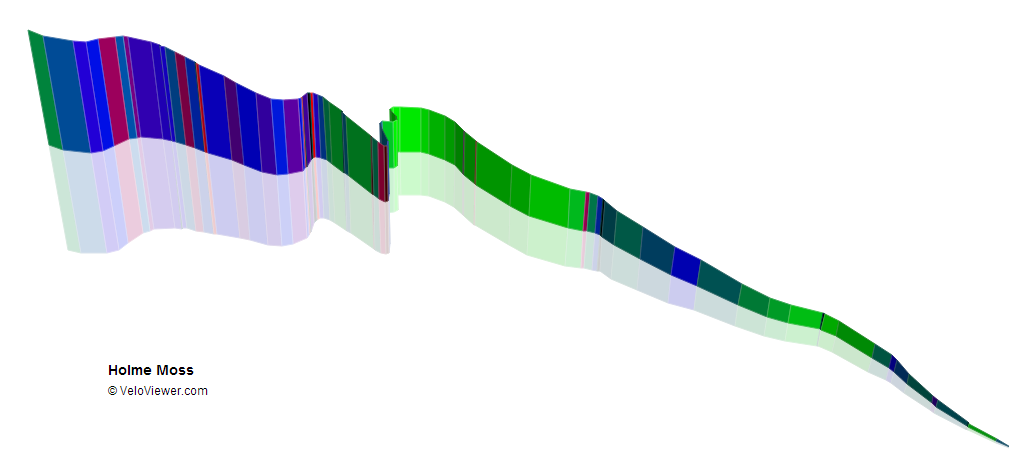
View Holme Moss segment on VeloViewer to get interactive.
Puy de Dome, France
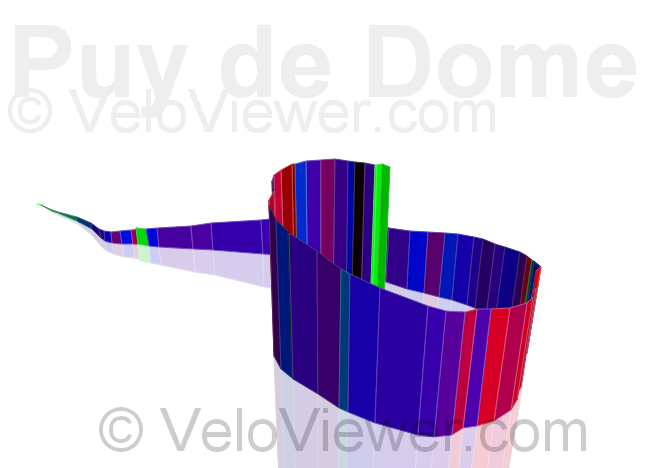
View Puy de Dome segment on VeloViewer to get interactive.
Hawk Hill, San Fransisco, USA

View Hawk Hill segment on VeloViewer to get interactive.
Elland CX Course, UK
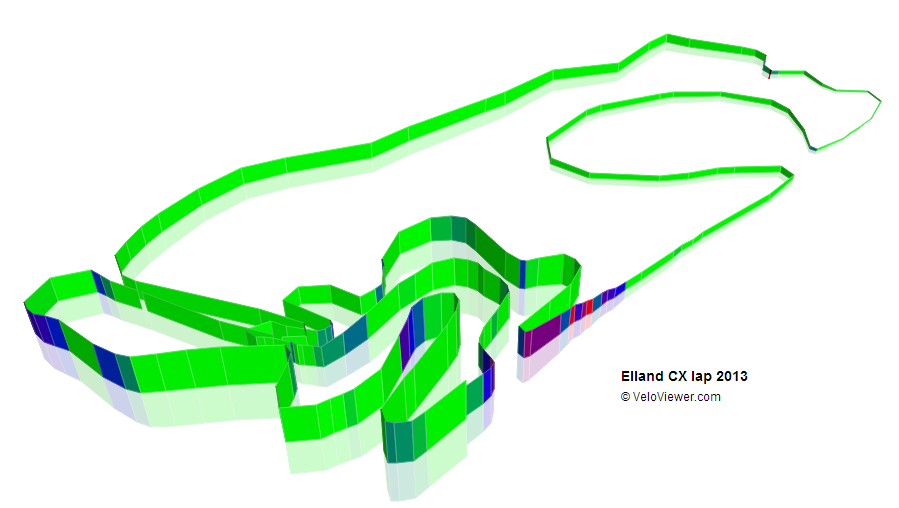
View Elland CX segment on VeloViewer to get interactive.
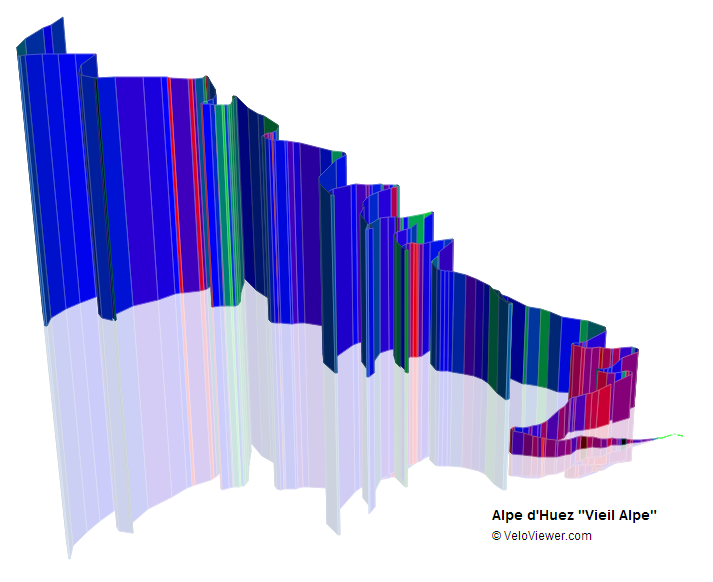
Alpe d’Huez, France
View Alpe d’Huez segment on VeloViewer to get interactive.
Please add in the comments links to the best 3D profiles that you find on VeloViewer. Enjoy!
Poop de Ville says:
This is a nice visualization.
http://veloviewer.com/segments/823435
http://veloviewer.com/segments/716621
http://veloviewer.com/segments/634846
http://veloviewer.com/segments/637362
Rocketeer says:
awesome
VeloViewLover says:
could you make it zoomable? PLEASE
Ben says:
yep, zoomable and panable. just need to work out how to let people interact with it in that way.
Ian says:
Absolutely sensational, chapeau
jerome says:
would you be able to toogle gradient colours on and off? would love to print some out in different colour schemes
Anders Fougner says:
Awesome!
Would be great to see a color scale/legend along with the profile.
PS. The direct link to the 3d profile doesn’t work. Example: http://veloviewer.com/segment/4866677/#p3d
The only way is UP says:
Run to the top of Menorca…
http://veloviewer.com/segments/2587302/athlete/244427
5kywalker says:
Very, very cool!
Keep up the good work.
#Tireless
Patrick Smith says:
These are really beautiful, and finally an accurate rendition of a climb, the Box Hill one is exactly how I picture it rather than a graph with a five per cent incline going across the screen. Well done.
Patrick Smith says:
Galibier http://veloviewer.com/segment/4717088
Ben says:
Cool. This one has much better elevation data (and so is a bit easier on the eye): http://veloviewer.com/segments/1613885
Ed says:
I need to have a crack at this one at some point. http://veloviewer.com/segments/3583750
Sam Andrew says:
That’s awesome, but it would be even more awesome if you could compare multiple climbs at the same time! and get a feel for the size of 1 climb compared to another. might be easy to do this by just loading two climbs next to each other and loading them to the same scale.
Ben says:
The scale thing is tricky. It makes each segment fill the area available whatever it’s length and adjusts the elevation stretch to make smaller climbs look slightly more impressive. Tricky trying to find a sweet spot. Comparing two side by side would have to sync both distance and elevation scales.
The longer I’m spending writing this response the more I want to try it out though! Can’t think of a good way to allow 2 segments to be picked though. Might have to be a URL hack with segment id’s for now.
Stian Larsen says:
How about a way to control exaggeration of elevation. For us living in hilly, but not mountainy areas, hard segments look a little flat and makes it difficult to visualize the actual feel of the segment.
Google Earth has a setting where you can do this, and it is much easier to get a feel for the terrain when you multiply elevation by 3x.
Stian Larsen says:
Look at this sorry segement 😀
http://veloviewer.com/segments/4203911/
Stian Larsen says:
…which looks a lot nicer with elevation streched! Very nice job!
Project the profile on top of a flat map, and it would be a killer elevation profile tool!
Ben says:
You’re the 2nd to ask about putting the map underneath. From looking at support for this kind of thing in CSS3 it’ll only be able to work in Chrome and Safari. I’ll give it a go!
Craig says:
Here’s the London 2012 MTB Course at Hadleigh Farm
http://veloviewer.com/segments/5159360/athlete/194062
Ben says:
Nice one. I like it!
matt mccluskey says:
Ben,
Any thoughts about implementing this with Rides, not just Segments? I think there’d be some interesting “digital artwork” for mountain bike rides.
Ben says:
Went live last night http://veloviewer.com/route and can also provide 3D profile of the new Strava Routes as well as existing activities. I will, at some point, add a dedicated activity details page with 3D, charts and segment lists.
matt mccluskey says:
So confused on your instructions for 3D activities. Dragging links? Bookmarking what now? HUH? Sorry.
Ben says:
Bookmarklets are really powerful things but at the geeky end of the usability scale! Lets say you are using Chrome on a PC/Mac as that is easiest (not going to work on an iPad etc).
1. navigate to http://veloviewer.com/route
2. Click on Chrome’s menu (3 horizontal bars on button in top right)
3. Chose “Bookmarks” then make sure “Show bookmarks bar” is ticked.
4. You should now see a row of buttons for any bookmarks you’ve got set up just below the address bar at the top of the Chrome window.
5. Left click and drag the 2 links at the top of my route page up to this Bookmark bar. They should now appear as buttons on that bar.
6. Head on over to http://app.strava.com and click on someone’s ride so you are looking at their ride details.
7. Click the “3D Activity” button in you bookmark bar.
8. Chances are Chrome will say “Popup blocked” at the right hand side of the address bar. You need to click on that and allow popups from app.strava.com.
9. Press it again and this time a new window will open showing you all the 3D goodness!
Like I say, at the geeky end of the scale and no way to make setting them up any easier I’m afraid.
If you are using the new Routing features in Strava then if you are in “edit route” mode for a previously saved route then you can press the “3D Route” button in your bookmarks bar and see the same thing for that route.
Like I say, I will build a dedicated activitiy details page that will be just a click away from your activity list at some point but I initially built the bookmarklet as I wanted a 3D profile for a new Strava Route which isn’t available via the API and this was the only way.
Good luck!
matt mccluskey says:
Ahhh! It worked. I think maybe this was a better explanation.
Thanks!
Guillaume says:
This looks incredible. Have you considered having something other than a white background, maybe a map or a 3D view with the Google Earth plugin?
Ben says:
I’ve got the grid on there now. I had a try with trying to put a map underneath but nearly melted my brain trying to get it to line up correctly and still didn’t get close.
Ric says:
A map in monochrome (in a very light shade, not 100% black) could sometimes be
useful, such as if a climb passes through a village that you can use as a reference point, but beware information overload of too much mapping info
getting in the way. The 3Ds have an elegant look about them at the
moment.Grid lines are good if they aren’t just decorative but actually to scale (kms or miles?) to show the climbs’ extent.
Armin Heurich says:
That’s a terrific tool! Check out this route that a group of us did last Saturday. It’s called the Highlander Quads hilla, 106 miles and over 10K ft of climbing.
http://veloviewer.com/route/231