 The goal of VeloViewer Explorer Tiles is to encourage people to discover new roads, trails, places and even new sports. Part of VeloViewer since 2015 with new exploration features and challenges added over the years which this page bring together as an overview of what is available. Explorer Tiles, Score, Max Square, Clusters and more, which you can see on your VeloViewer Summary page, Activities page, Global Heatmap and in the overall leaderboards, will be described below.
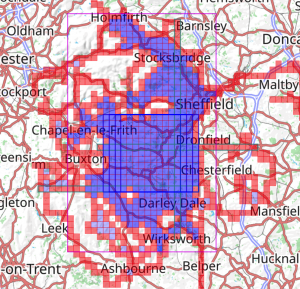
Explorer Tiles
The entire world is overlaid by a 16,348 x 16,348 grid with each resulting square representing a VeloViewer Explorer Tile. The tiles are based on Slippy Map Tilenames on the Web Mercator projection used by OpenStreetMap and Google Maps at a zoom level of 14.
For most of us, this results in square tiles that are roughly 1 mile across. The tiles actually get smaller the further away from the equator you get due to the distortions resulting in the projection of the globe onto a 2D map. The simple goal is to visit a tile on one of your rides/runs/etc and it will be “ticked” in VeloViewer.
Ticking new tiles will soon be taking you to places you’ve never been before both close to home and further afield. Some tiles are easy to tick off, others take you off the paved roads and potentially off the bike entirely. Sometimes a hike or run is sufficient, other tiles may require a kayak or sailing a dingy. Some tiles might be on private land where you may be able to enter a running event or an open day in order to gain access. Some tiles are truly inaccessible, please do not break any local laws or access private property without consent in the process of ticking tiles!
Your total number of ticked tiles is the first of the Explorer metrics that you may wish to grow and compare with other Explorers in the all time leaderboard: Explorer Tiles Leaderaboard.
Note: If a tile isn’t showing as ticked in the Activities map then open the activity details to populate the definitive set of tiles for the activity based on all recorded data points. From then on, the correctly ticked tiles for that activity will then be used on the Summary and Activities page. More information about why this may be necessary available here.
Top tip: When recording activities for tile ticking on Garmin devices, make sure you use “1 second recording” rather than “Smart recording“. Garmin’s Smart Recording will record fewer data points but that might mean you end up not ticking tiles as no points were recorded in the tile.
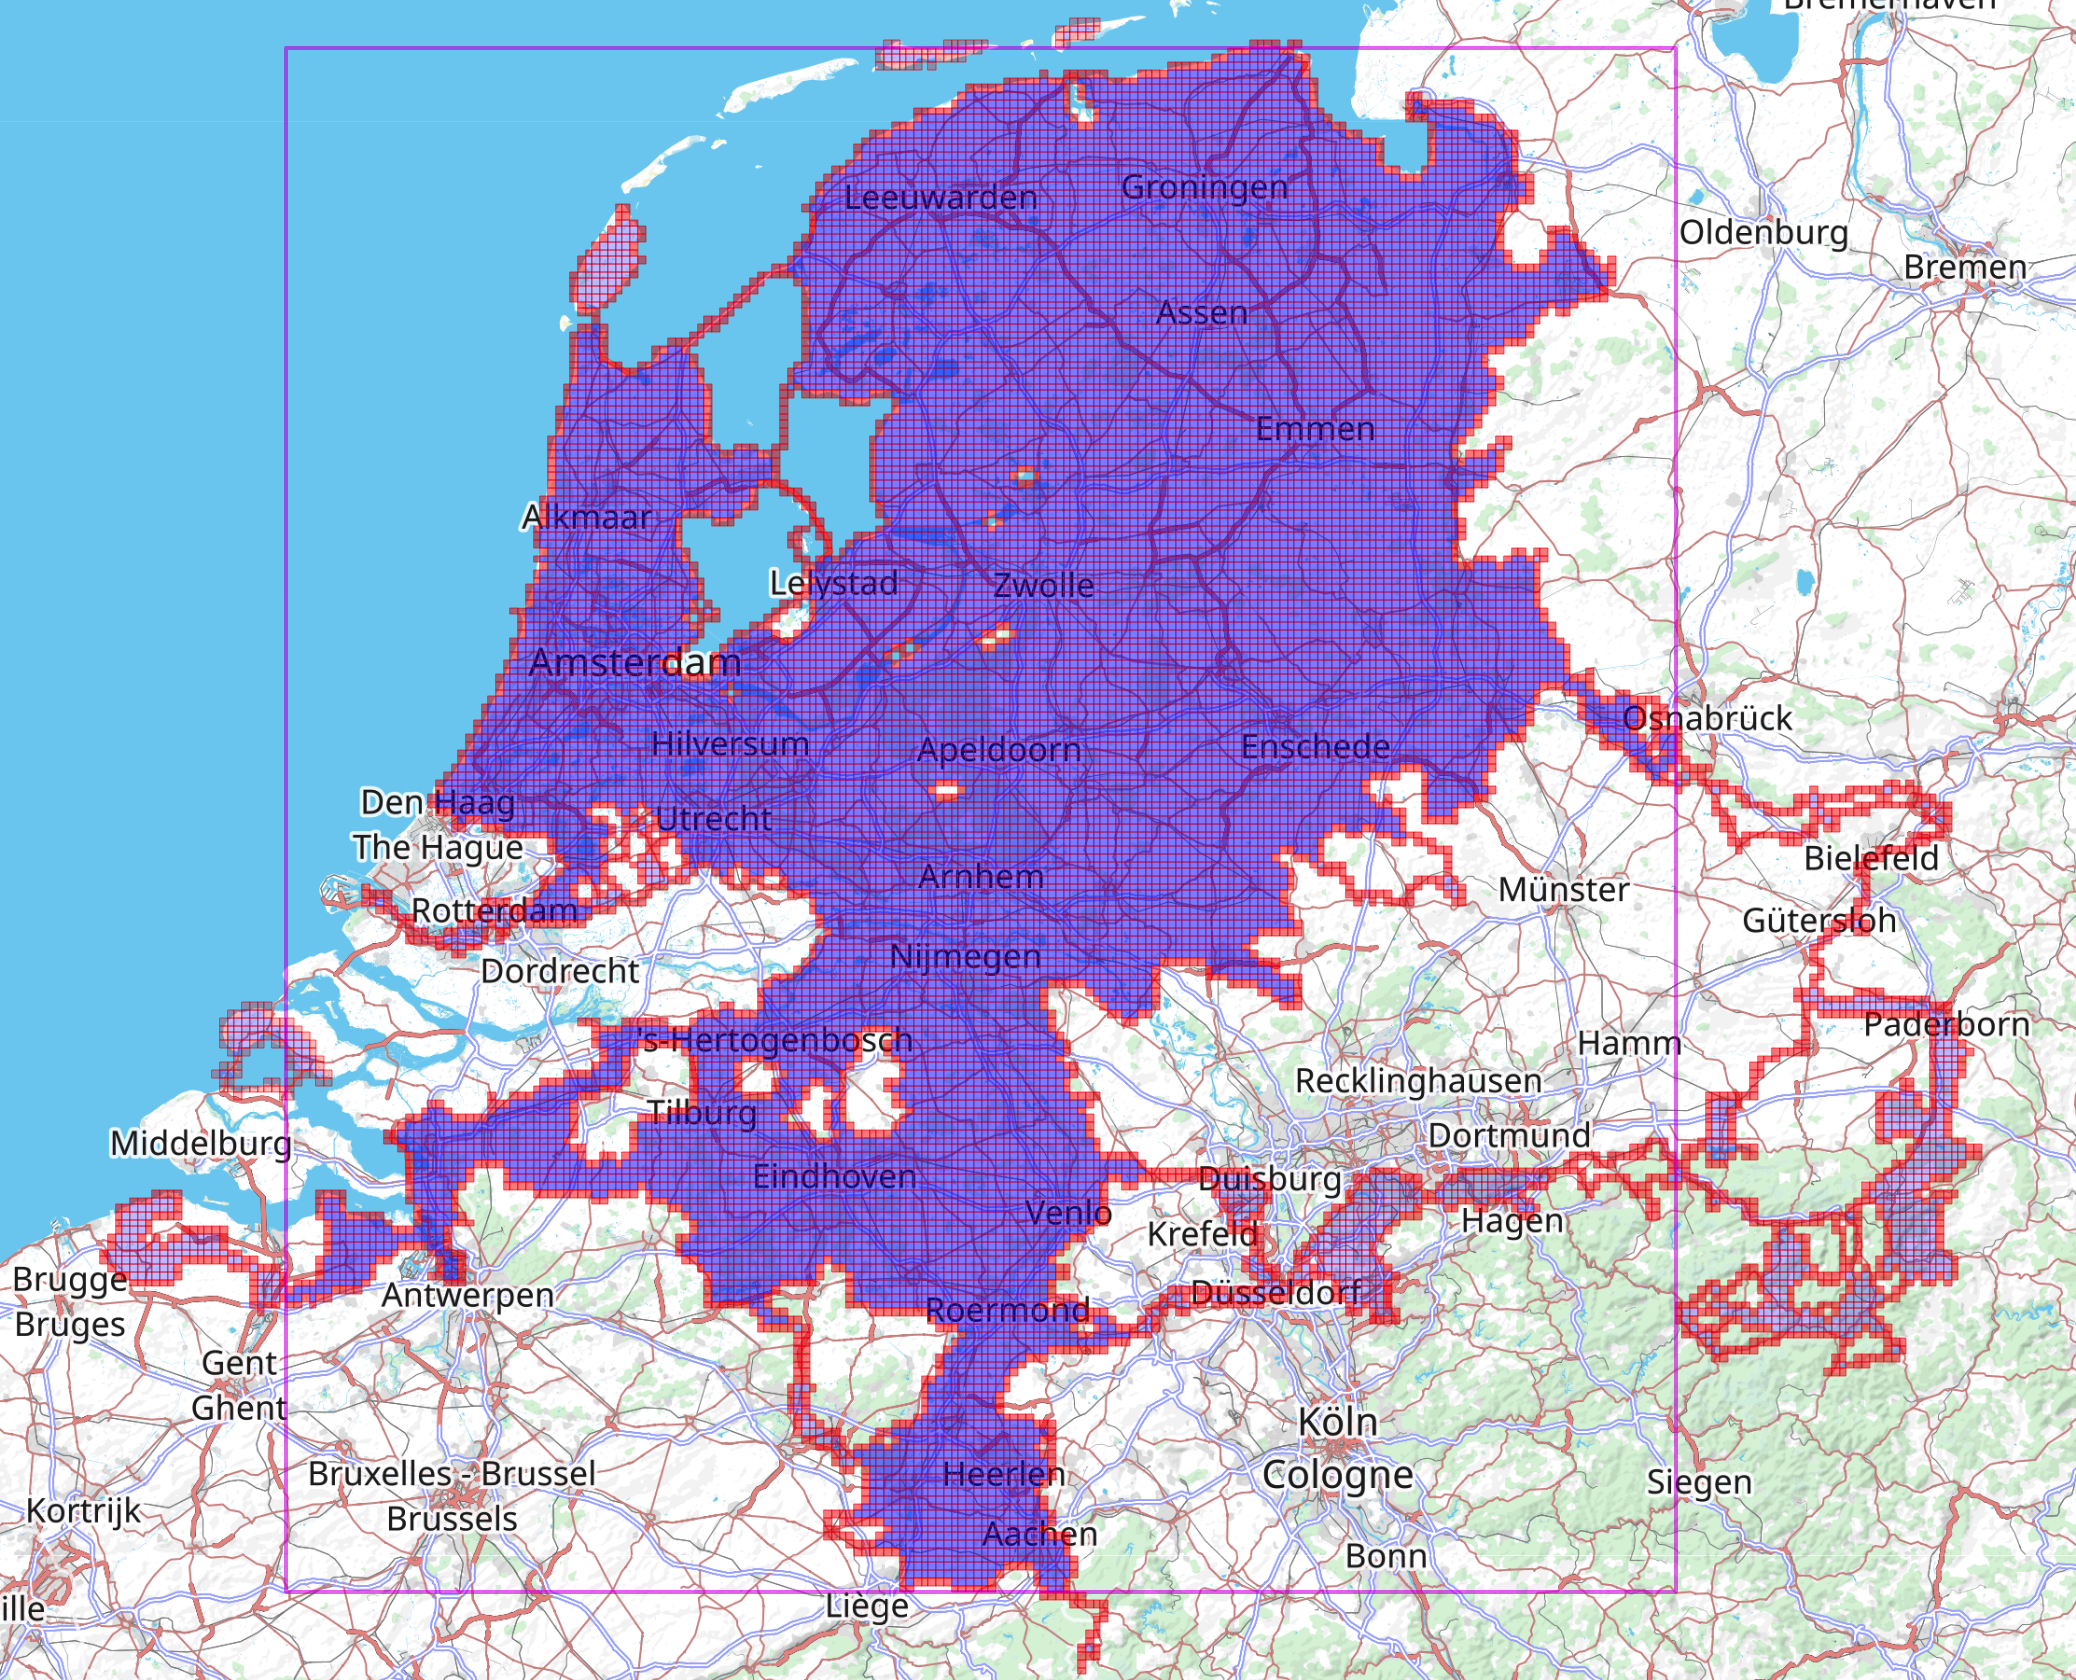
Explorer Global Heatmap
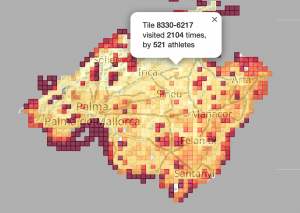
The VeloViewer Explorer Global Heatmap provides a view of all the world’s tiles coloured to show how many people have visited each one. These visitor counts for each tile are then used to calculate the Explorer Score. More details on Global Heatmap available here.
Explorer Score
For those who love getting out into the wilderness where few others venture, the Explorer Score could be for you. The fewer the number of visitors to your tiles there are, the higher your score:
- 1 to 10 visitors: 5 points
- 11 to 25 visitors: 4 points
- 26 to 50 visitors: 3 points
- 51 to 100 visitors: 2 points
- 101 or more visitors: 1 point
Total up those points for all of your visited tiles and you have your Explorer Score.
Of course this does raise the question of whether you should go on tile-ticking adventures on your own or with other people. Doing them on your own could result in a higher score. However, ticking tiles is far more about the experience of getting out there and seeing new places than the resulting stats so I’d always recommend the more social option when available and not get hung up on the numbers!
Notes: The way these individual tile scores are calculated is based on the tiles you have included in the Explorer Global Heatmap. If you have private activities or have not opted-in for your public tiles to be included in the Explorer Global Heatmap then you will only score 1 point per private tile.
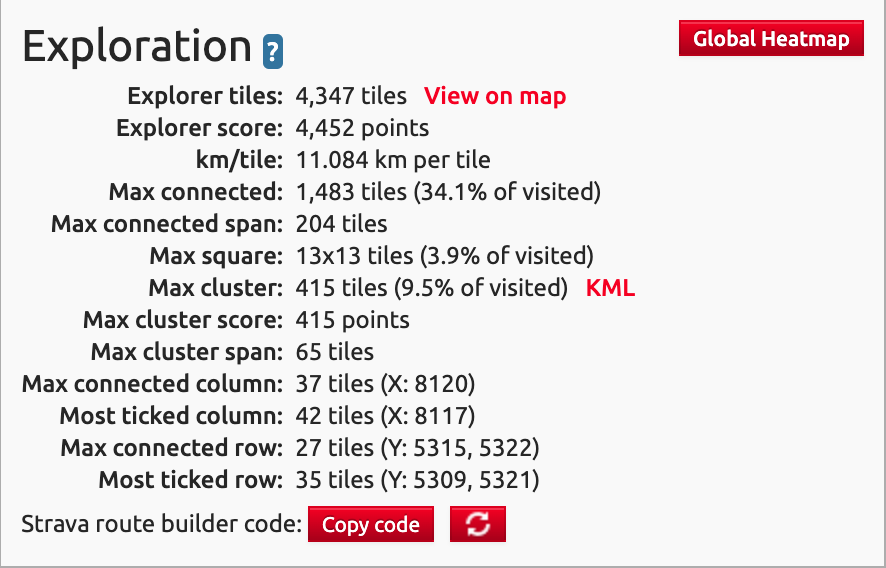
Max Connected
Provided more for completeness as it was deemed to be not enough of a challenge when coming up with the concept of the Max Cluster. As long as a tile is alongside (top, bottom, left or right) another tile then those tiles are connected. A single long ride can connect multiple areas very easily whereas connecting Clusters is much more tricky.
Note: If you have a diagonal line of tiles that is missing a a direct top/bottom/left/right connection then open the activity details to populate the definitive set of tiles for the activity based on all recorded data points, and then the Activities map will most likely plug that gap and show a larger value for your connected tiles.
Max Connected Span
The Max Connected Span rewards how far you have extended your Max Connected Tiles to the North, South, East and West. It is calculated as follows (note, each tile has an X and X value between 0 and 16,347 to indicate its location on the world) using the max and min X/Y values for your Max Cluster tiles:
([Max X] – [Min X] + 1) + ([Max Y] – [Min Y] + 1) = Max Connected Span
When you have the Columns/Rows (see below) shown on the Activities page map then you will see the outline of the Max Connected Span also shown.
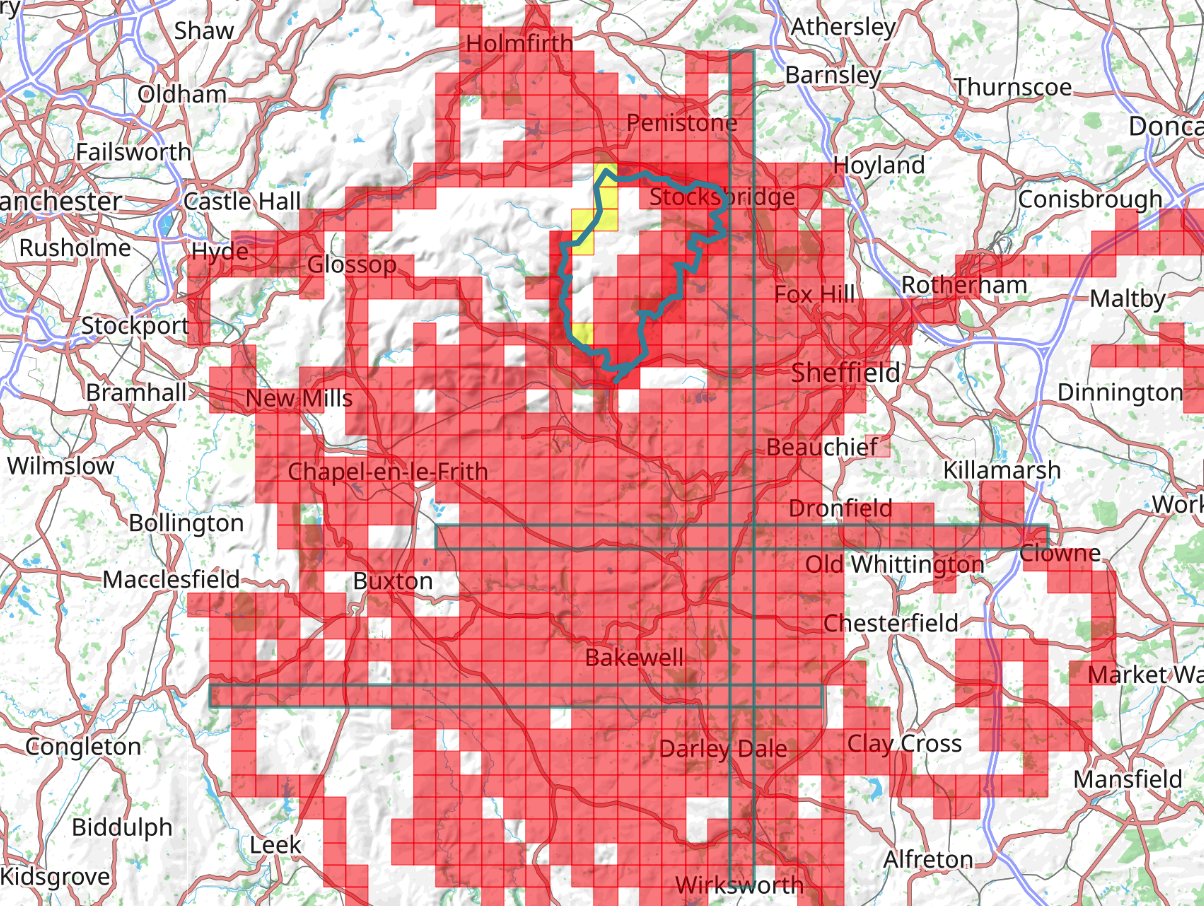
Max Square
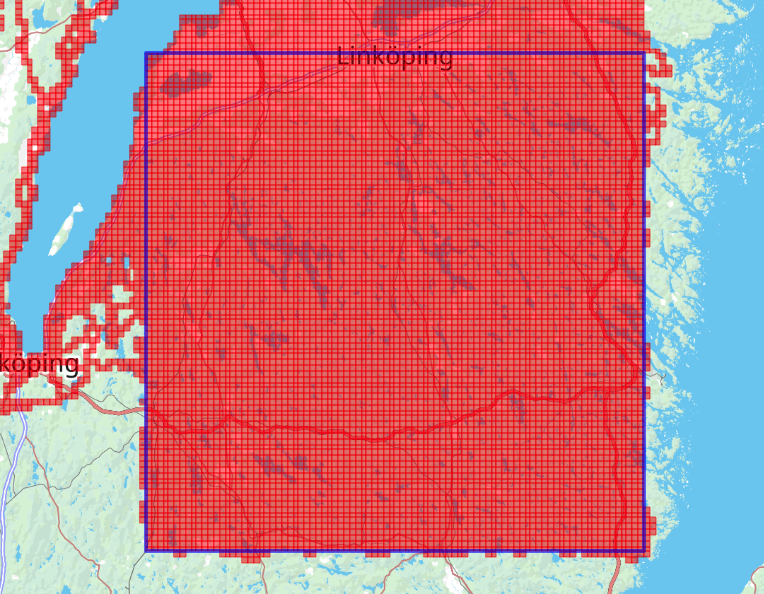
If you are wanting a bit more structure to your Exploring then why not try and build your Max Square. This basically is what it says on the tin… the biggest square of tiles that you have ticked. View your Max Square on your Activities page by clicking the “🔲” button on the right of the map. More details on the Max Square here.
Max Cluster
Water, mountains or truly inaccessible tiles may hamper your Max Square growth depending on where you live which resulted in the creation of the VeloViewer Explorer Max Cluster. If a visited tile is surrounded (above, below and to the sides) by other visited tiles, it becomes part of a Cluster. This can then be grown around geographic obstacles in any direction. Linking your max Cluster to other sub-Clusters with corridors of 3 wide visited tiles can result in truly massive Clusters spanning multiple countries, check out the Activities page maps for the top people in the Max Cluster Leaderboard. View your Max Cluster (and sub-Clusters) on your Activities page by clicking the “![]() ” button on the right of the map.
” button on the right of the map.
Max Cluster Score
Uses the same logic as the Explorer Score described above but applied to the tiles that make up your Max Cluster. There is potential to increase your Explorer Score fairly easily by taking a holiday to somewhere remote and ticking a bunch of tiles that nobody has done before. Trying to do that in the context of your Max Cluster is much more of a challenge.
Max Cluster Span
The Max Cluster Span uses the same logic as the Max Connected Span but only applying to the tiles that make up your Max Cluster.
When you have the Max Cluster shown on the Activities page map then you will see the outline of the Max Cluster Span also shown.
Columns/Rows
Getting very niche now, but in the as always in VeloViewer, if there is a stat to be worked out, it’ll do it!
Two values are provided for both rows and columns of columns:
- Max connected – ticked, adjacent tiles in a single column/row. You may well have gaps in ticked tiles so this stat is the maximum number that are ticked without any gaps.
- Total ticked in a column/row.
Leaderboards
As mentioned a number of times above, the “Overall & Club Yearly Leaderboards” (linked from the “Leaderboards “menu item) provides leaderboards and distributions of values across all of the above metrics. You can also view each by year or activity type (apart from Explorer Score that is only visible for all years+types).
Up for a new challenge? Why not target a yearly Max Square or Max Cluster from the new year and track your progress against others in the leaderboard.
Strava Route Builder Overlay
Planning routes to tick tiles is at least half of the challenge. You can of course do this in any route planning site but if you are using Strava to plot your routes then you can use the VeloViewer Chrome Extension which will make you life much easier by overlaying your currently ticked tiles along with the highlighting of new tiles that will be ticked by your planned route. More info on the Chrome extension here.
See the full list of Explorer related blog posts for lots of stories from fellow Explorers.