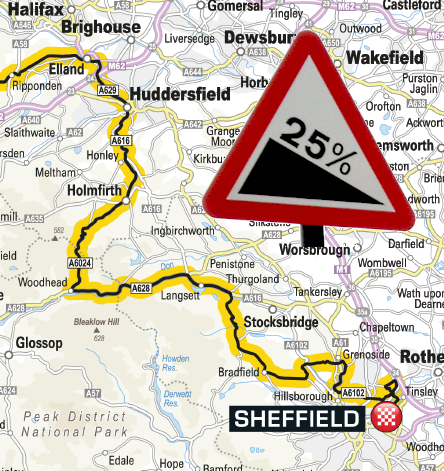
 In a previous post I covered the climbs of the first half of stage 2 of the 2014 Tour de France on its way from York to Sheffield (also available is the climbs of stage 1). This post will cover the remaining climbs of the stage that could well be providing a safe pairs of shoulders for both the Yellow and Polka Dot Jerseys for a good number of days. Holme Moss is certainly the biggest climb of the day but the many small and steep climbs (and slippery, twisty descents) on the run-in to Sheffield are more likely to cause the upsets and there is a real sting in the tail with up to a 33% gradient on Jenkin Road just a few km from the line. Tom Boonen and Matt Goss both crashed fairly badly in this area during the 2006 Tour of Britain but hopefully those won’t be the kind of headlines of the day.
Other posts for Tour de France 2014: Climbs of Stage 1 – Climbs of Stage 2, Part 1 – Cote de Buttertubs – Cote de Holme Moss – Cote de Jenkin Road – Strines.
For details on the climbs for the first half of the stage (up to and including Cragg Vale) see The Climbs of Stage 2 of the 2014 Tour de France – Part 1.
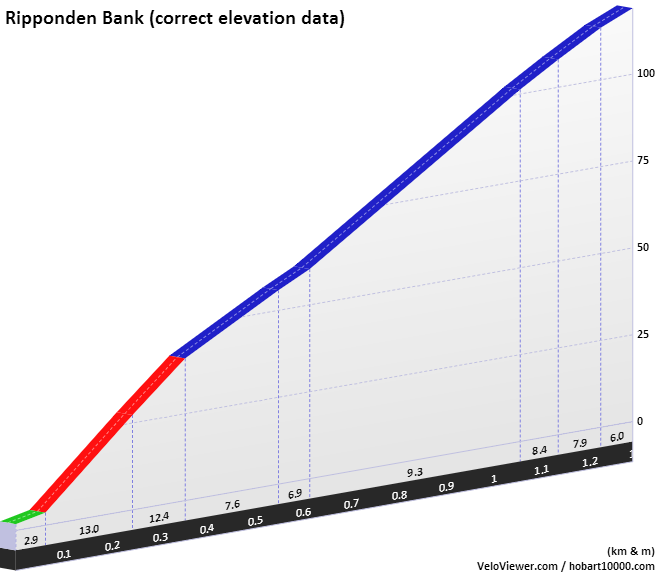
Ripponden Bank
Elevation gain: 121 m
Maximum elevation: 250 m
Average gradient: 9.1 %
Maximum gradient: 16 %
Strava climb category: 4
View maps, graphs, photos and stats on Rippondale Bank.
The stage profile shows a slight blip on the descent from Cragg Vale (smoothing of the profile hiding the true size of the blip) which on further investigation reveals a very stiff kilometre of climbing. Ripponden Bank hosts regular hill climbs (some photos) and will immediately have you searching down your gears.
Elland to Ainley Top
Elevation gain: 147 m
Maximum elevation: 220 m
Average gradient: 7.0 %
Maximum gradient: 8.0 %
Strava climb category: 4
View maps, graphs, photos and stats on Elland to Ainley Top.
This road might be a dual carriageway but that will only make the climb feel longer and more draining. A relentless drag up to Ainley Top finally gets you to a point where you can almost free-wheel all the way down to Huddersfield.
Holme Moss
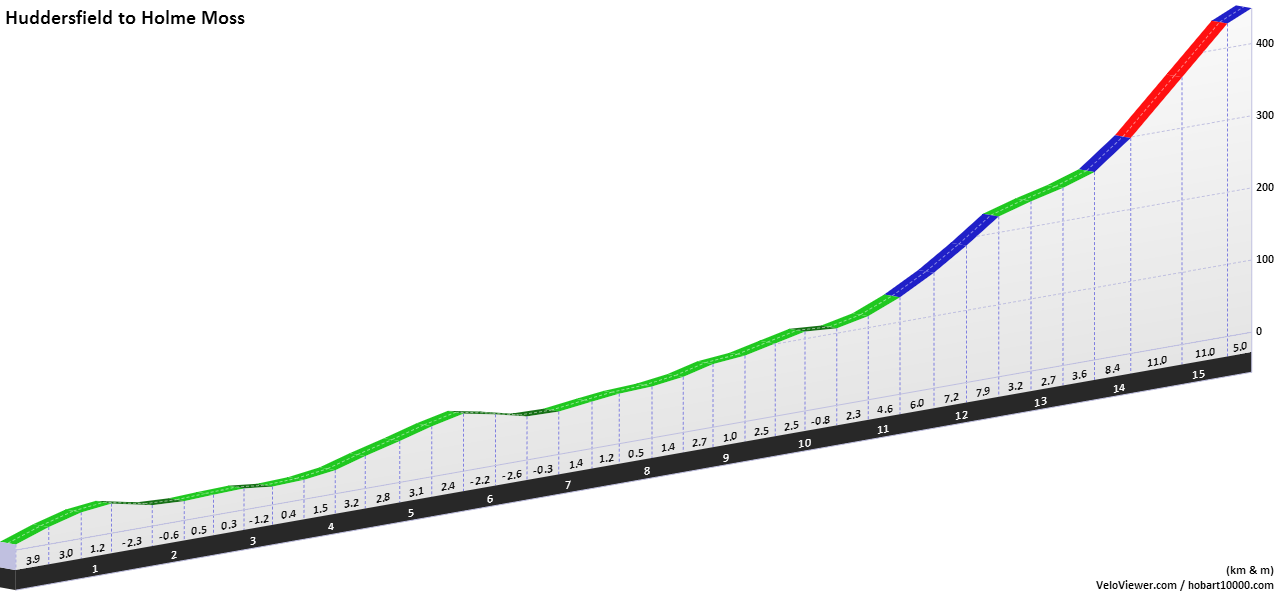
The climb to the summit of Holme Moss starts (albeit gradually at first) down in Huddersfield and climbs 441m in almost 16km. Following the valley of the River Holme the gradients only really kick in at Holmebridge:
Elevation gain: 341 m
Maximum elevation: 524 m
Average gradient: 7.3 %
Maximum gradient: 14.0 %
Strava climb category: 2
View detailed post on Holme Moss.
View maps, graphs, photos and stats on Holme Moss.
Expect huge crowds on Holme Moss on race day and rightly so, the roadside of the high point of the stage will provide a great viewpoint to see the Tour approaching up the valley. Nothing beats seeing the helicopters slowly edging closer as the race approaches. Probably a little far out from the finish to have the GC favourites showing any of their cards but there will certainly be plenty of people suffering up the climb. Read a detailed review of Holme Moss here.
The KOM on a segment like this very rarely changes but lo and behold, yesterday local pro Dean Downing took the crown while his brother waited around for him taking photos. Good effort lads.
Woodhead Pass
Elevation gain: 218 m
Maximum elevation: 459 m
Average gradient: 3.0 %
Maximum gradient: 5.0 %
Strava climb category: 3
View maps, graphs, photos and stats on Woodhead Pass.
After a fast descent down into Derbyshire from the summit of Holme Moss the Tour quickly turns left and heads back up Woodhead Pass and back into Yorkshire. A popular route for lorries so never features highly on any climb to-do list of the area so if you are tackling the route then do take care. The climb itself is fairly unremarkable but the views and situation on the moors can be quite impressive.
The full route’s elevation profile hides most of the “brutal” subtleties of this final 30km so here’s that section in greater detail. None of the climbs are on the same scale as those already covered in the stage but with a crescendo in pace and the steepening gradients both on the climbs and descents will make for fireworks.
Midhopestones
Elevation gain: 156 m
Maximum elevation: 348 m
Average gradient: 6.4 %
Maximum gradient: 15 %
Strava climb category: 4
View maps, graphs, photos and stats on Midhopestones.
A long, smooth, wide descent from the summit of Woodhead Pass will allow the peloton to reorganise themselves and attempt to get their leaders to the front of the bunch prior to turning onto the narrow roads that make up most of the remainder of the stage. Turning right into the small village of Midhopestones the road starts fairly steadily but ever so slightly increases in gradient up to the 1km mark. With this initial crest surmounted the remaining drag to the true summit will potentially be one of the most fought over of the day’s stage as at the summit the road dives down through 2 sections of 25% with the later leading into a very sharp hairpin bend. Being in the first few riders heading into the descent could make the difference between being part of the lead bunch through the remainder of the stage and being caught behind a crash.
Mortimer Road to Penistone Road
Elevation gain: 117 m
Maximum elevation: 357 m
Average gradient: 5.3 %
Maximum gradient: 16 %
Strava climb category: 4
View maps, graphs, photos and stats on Mortimer Road to Penistone Road.
Tight, steep corners on a less than perfect road surface lead the riders across a narrow bridge and straight into a very steep, but short pull to start this next climb. It was tackled in the 2006 Tour of Britain in very wet conditions (video). Once through the initial steep section the remainder of the climb seems fairly calm in comparison. The top of the climb gives way to a rare flat section of road on a wonderfully smooth road surface with great views to boot.
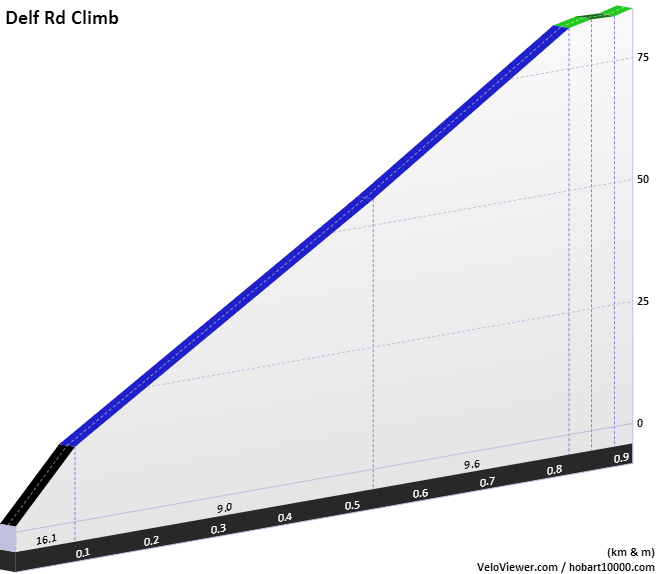
High Bradfield to Kirk Edge/Delf Road
Elevation gain: 84 m
Maximum elevation: 353 m
Average gradient: 9.2 %
Maximum gradient: 19 %
Strava climb category: 4
View maps, graphs, photos and stats on High Bradfield to Kirk Edge/Delf Road.
A sweeping descent brings you to a relatively sharp left hand turn in High Bradfield and an immediate kick in gradient to 19%. The gradient backs off to just under 10% up to the summit and your first views of Sheffield. The road traverses high and exposed as it begins the long descent down to Worrall and Oughtibridge so expect some great helicopter shots alongside the leading riders.
Jaw Bone
Elevation gain: 159 m
Maximum elevation: 249 m
Average gradient: 9.8 %
Maximum gradient: 15 %
Strava climb category: 4
View maps, graphs, photos and stats on Jaw Bone.
A real leg breaker of a climb, especially this late in the stage. A slight respite at half height but quickly back into it again. With only 9km remaining to the finish of the stage we should expect to see some of the big guns attempting to drop the other GC rivals at this point. After reaching the summit the route descends down to some very bumpy roads and up a slight climb on Herries Road (1.3km @ 4.6%) before weaving round to the foot of the final and most brutal climb. Here’s a video of a recent one-handed ascent of the climb.
Jenkin Road
Dedicated blog post for Le Cote de Jenkin Road available here.
Click image to see in Google Street View.
I’ve had my protractor out and that telegraph pole is at 30 degrees to the pavement which makes for a crazy grade of 58%! Not sure how much of that angle is due to any distortion in the picture but it’s fair to say it is an incredibly steep bit of road (I’ll stick with the slightly more believable 33.3% elsewhere in this post). And it isn’t on a sharp bend so there is no way to flatten it out by riding on the opposite side of the road. After 200km of riding, these few 10’s of metres will possibly provide the biggest time gaps of the day:
Elevation gain: 94 m
Maximum elevation: 136 m
Average gradient: 11.2 %
Maximum gradient: 33.3 %
Strava climb category: 4
View maps, graphs, photos and stats on Jenkin Road.
The steep section is short enough not to record on GPS units so doesn’t show up on the profile but there is no denying it is there. At first the climb doesn’t appear too bad but as the first slight corner is rounded the wall of inescapable tarmac is all to obvious. What makes it slightly worse is that you will have just turned your back on the finish line at the bottom of the climb and are riding in the opposite direction with the finish visible in the valley below should you wish to turn around and have a look.
From here it is a short but bumpy descent followed by a few flat km to the finish line outside the English Institute for Sport.
Downloads
Dean Downing rode the middle section of the climb and his data is on Strava (a potential recce of some of the stage for the organisers perhaps?) and last weekend I rode the last 30km from Langsett (view on VeloViewer or Strava).
Please let me know in the comments section (or @VeloViewer on Twitter) if you spot any errors. The maximum gradients are a bit of a guess on a few of the climbs but should be there or thereabouts.


Bob says:
30 degrees doesn’t make for a gradient of 33.3%!
Ben says:
More than happy to be told I’ve got something wrong but please make your comments useful by saying what would be the right answer and why.
Bob says:
Sorry. I should have said that 100% = 1 in 1 = 45 degrees. You seem to have assumed that a 100% slope is 90 degrees, whereas the percentage slope of a 90 degree angle is infinite.
Pete says:
Looking forward to it already!
Re gradient – if it is a 30 degree angle sloping upwards then by standard convention it would be 100/square_root(3)% in percentage terms. Which is a fearsome 58%!
There is a wikipedia page called Grade_(slope) that has some of the details on conversion – hopefully Strava do actually use that convention!
Ben says:
Thanks for the comment Pete, I’ve updated the text. Strava (and I) are always working with run and rise so the % grade is easily calculated. This was the first time I’ve ever started from an angle and I obviously didn’t think about it too much (it was very late)!
James Mappin says:
Just rode the Jenkin Road climb today. Jeeze it’s steep. I went on my ‘summer’ bike which has slick tyres on it which was a mistake in the cold conditions. Had a bit of wheelspin on the steep section around the corner around where that photo was taken. I’m glad I made it though and only 1 of a select few to do so (on Strava that is).
Peter E says:
Just by taking measurements off the wall (least distorted lines). I get 29% gradient. Rise over run…
trek says:
GPX page wont load any chance of you redoing it
cheers
Ben says:
sorted. Thanks for letting me know.
Martin GT says:
Awesome, loving it!
Squeakin says:
I live at the top of Jenkin Road. I ride to work almost every day. I have ridden up my road 5 times in 3 years, on the 4th time I got up without stopping, did it once more to prove it wasnt a fluke and go 5 miles out of my way to avoid it. You can argue all day about the gradient but one thing is certain……Its bloody steep!!. Cant wait to watch the TDF coming up my road, so excited.
Ben says:
Fantastic. ‘Nuff said.
Richard.T. says:
Good guide well done.Both days will be a tremendous test even for the best.Would prefer to see airport runway used for finish line rather than EIS.Loads of room for teams,media and spectator grandstands and would make a great sprint finish even though Cav and the other sprinters will be left behind on Holme Moss!! Either way it will be brilliant and I will be there!
ondrugs says:
the link to the GPX is bust. can we get it again please?
Ben says:
There you go. Should be fixed now.
ondrugs says:
it is! thanks!
Davo says:
I also live on Jenkin Road near the top. 4 weeks ago I came off my MTB going down the hill at speed and crashed into the lamppost which is across the road from the picture on here. I now have a broken arm and a metal plate as a reminder. I can’t wait to see the pros do this next year. I’m sure they won’t hit my lamppost?!
AndyMell says:
I too live on Jenkin Rd, just few houses up from the picture!
Always take my hat off to any rider who attempts to climb it.
So interested to see the Best in the world tackle it, put this little Hill on the map lol
Locals know how steep it is (Been used for Full Monty and even Top Gear) come test yourself on it.
caracas2 says:
Not to do with discussion but why doesn t Tour of Britain ever have a stage like stage 2 of Tour De France it would be far more exciting than the usual stuff. I mean hyping up one 100 meter climb on a stage 50 miles from the finish is ludicrous.
ducknumber1 says:
Hi, I’ve been using your guides to the hills as I’ve done them in parts. I’m also following the official maps and think you may have the wrong hill from Elland to ainley top, with the MG road markings being in Blackley?
Last section this weekend, Hudds to Sheffield.
Kenny Carwash says:
I rode from Midhopestones to Penistone Road last year without checking the gradient profile beforehand. I’ll do it again one day, but it remains the closest I’ve come to crying on a ride!