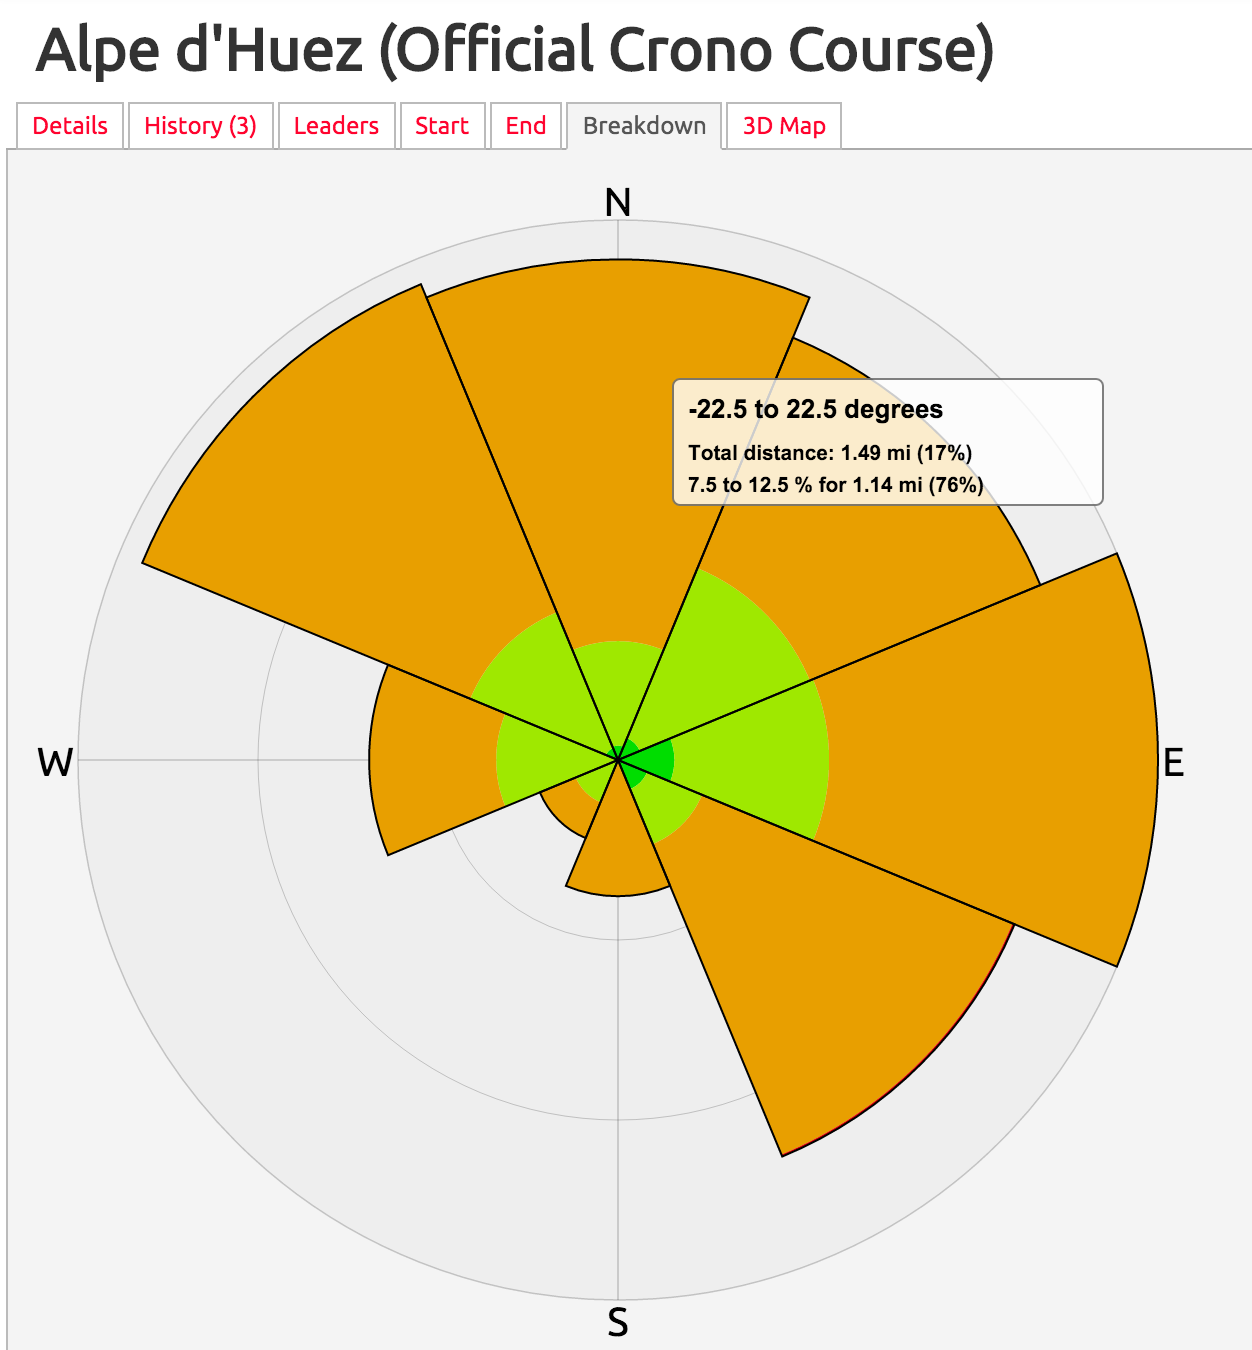
 A while ago I built a visualisation to display the orientation of roads in a defined area and had requests to have a similar view for activities. Well, two years on (I know!) and here it is, with the added breakdown by the gradient of the roads/trails. Just head to the “Breakdown” tab on any Activity, Route or Segment Details page. Filtering the selection in the top profile (Activity & Routes) updates the visualisation appropriately.
I think this falls more into the pretty to look at but only providing useful information to those really wanting to get into the real nitty gritty of a route perhaps when comparing against the potential wind directions etc.
There is a table of the corresponding data below the graphic.


Jason Smith says:
An amazing additional Ben and the velo team, surprisingly how important this can be for route planning in locations, countries not so well known, even sustrans routes running alongside canals while cycling across Britain. Another superb addition to veloviewer. Thanks.