 The Tokyo Olympics Men’s and Women’s road race courses have just been announced. I’ll let others debate the differences between the two courses and instead just provide the stats and maps.
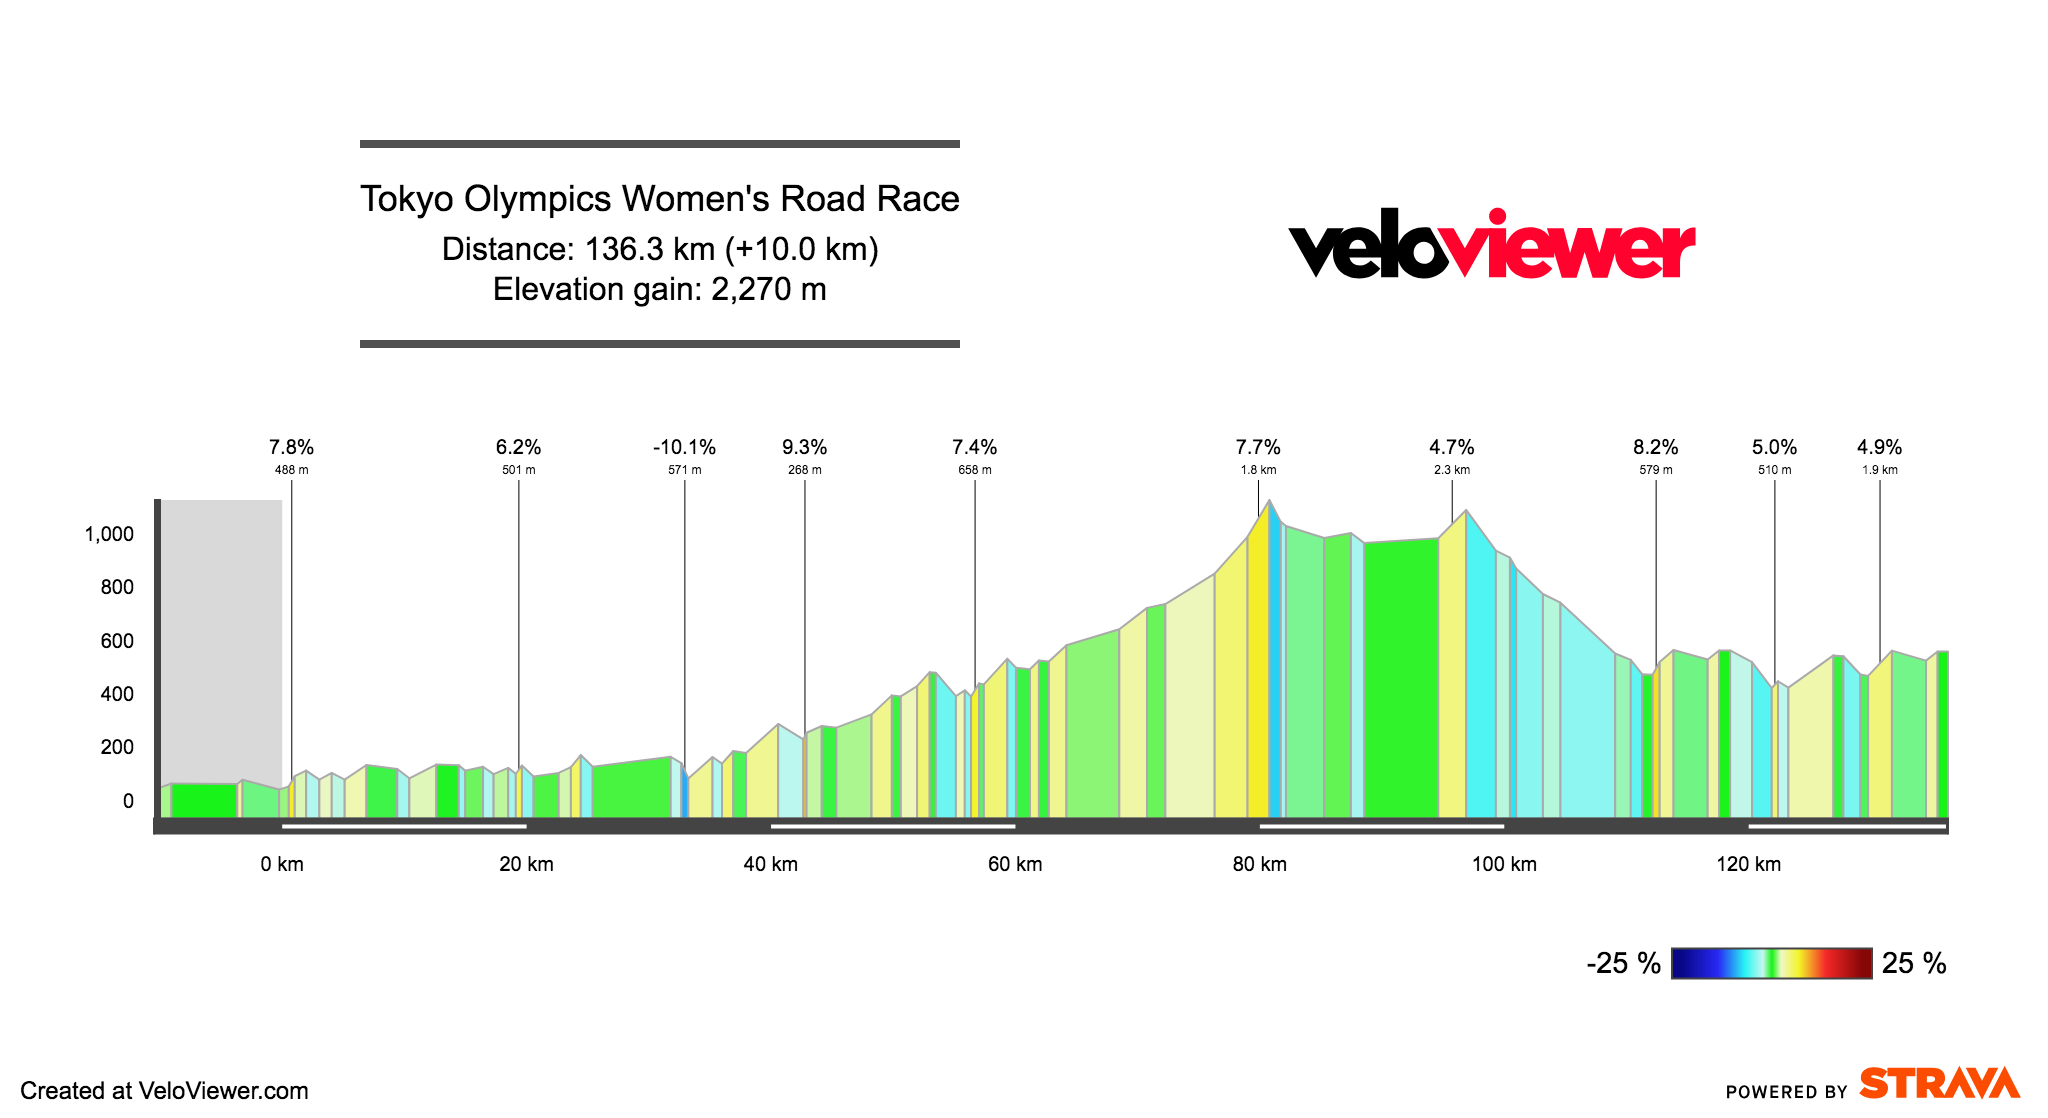
Both routes begin with 10km of neutral before another 33km of pretty flat roads. The next 47.5km climb just over 1000 metres giving an average gradient of just 2.2% but it never really maintains an even gradient until the final 5km of the climb which averages at almost 6% with a max of 10%.
A short (1.5km) descent is followed by 12.5km of flat roads skirting the shores of Lake Yamanaka before a 2.2km climb at 5% taking the riders towards the 14km descent (on pretty wide and safe looking roads) down to the Fuji Speedway racing track.
Here the men’s and women’s routes split with the women finishing off with 1.5 laps of a loop that takes in the fairly lumpy Fuji Speedway track and some of the roads just to the South. This final 24km still has just over 400m of climbing but probably nothing long or steep enough to shake off any remaining fast finishers.
(See below for interactive maps and profiles for both races).
Instead of heading onto the Fuji Speedway circuit at this point, the men’s course heads South before heading up a 15km climb ticking off 875 metres of the slopes of Mount Fuji. Averaging a fairly steady 5.8% with the odd steeper ramp and a max altitude of 1450m. Still 93km remaining from the summit means this may well tire a few legs but most of the action will be saved for the final, much steeper climb.

A long and very fast looking descent takes the men’s race onto 1.5 laps of the extended Fuji Speedway loop before heading away form the racetrack to the main climbing test of the day: the 6.8km Mikuni Pass.
The meat of the climb is 5km long averaging 11.5% and with a max of 17% but with 32km remaining to the finish it will be a brave climber that sets off alone for glory this far out. From the summit of the climb there is another short descent back down to the shores of Lake Yamanaka and the 2nd ascent of the short climb back over the ridge with 21.5km left to go. 15km of descending leaves only a 6.5km single lap of the undulating Fuji Speedway circuit and a spot in Olympic history.
Comparison to Rio Olympics
| Race | Location | Distance | Elevation Gain | VVOM |
|---|---|---|---|---|
| Women | Rio | 136 km | 1600 m | 47 |
| Women | Tokyo | 136 km | 2300 m | 47 |
| Men | Rio | 236 km | 3450 m | 87 |
| Men | Tokyo | 232 km | 4300 m | 90 |
Notes: Distances and (corrected) elevations are approximate and based on my calculated data. Race organisers often show total elevation values that are too high due to relying on less than perfect routing software’s elevation data. I use barometrically recorded elevation data for as much of the route as possible providing much more reliable totals and gradients which is one of the reasons why numerous WorldTour level teams use my services for all of their races 🙂
VVOM (VeloViewer Objective Measure): as described in more detail in this post, the VVOM provides a rating for the difficulty of a route. For the WorldTour teams (as used in the table above), the VVOM also takes into account the location in the stage that the climbing occurs.
As you can see in the above table, the distances and VVOM (overall severity) of the races are actually very comparable between Rio and Tokyo. There is a lot more climbing in both races at Tokyo but the character of the races are very different.


Mikuni Pass

