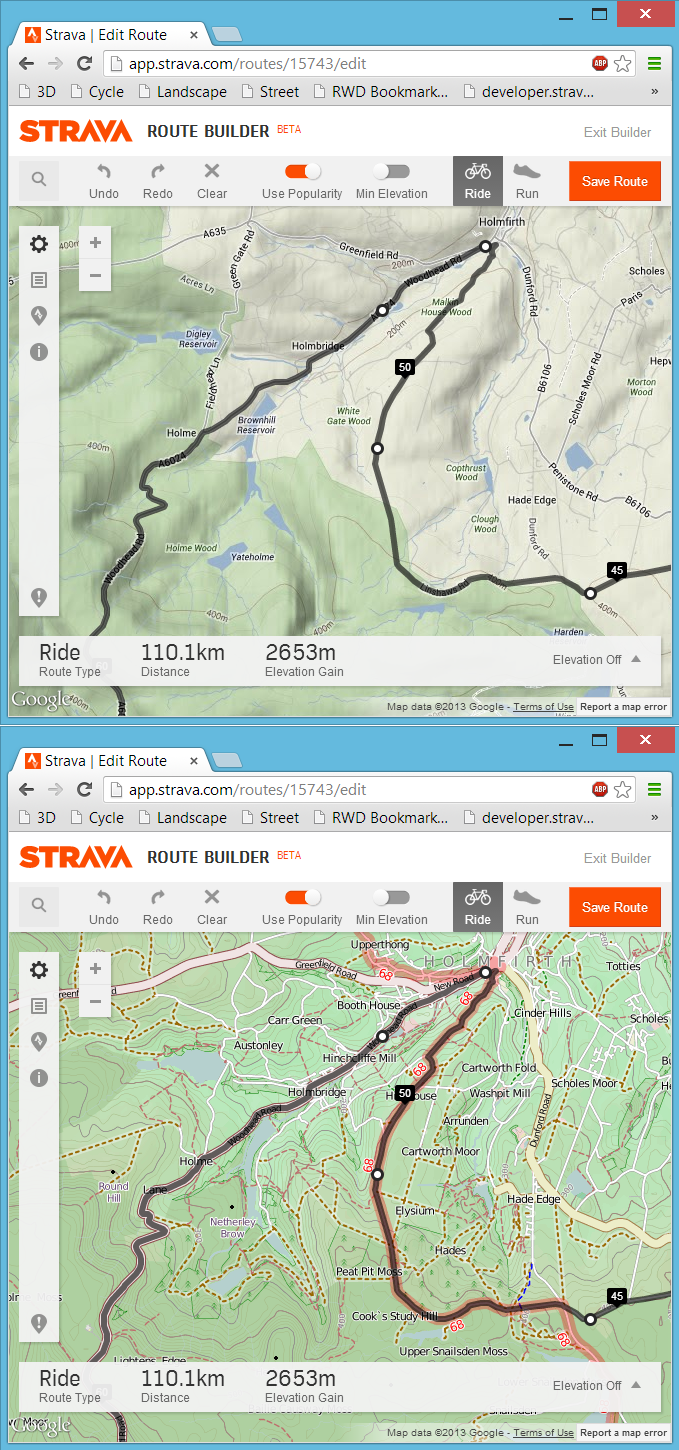
 Following on from my last post about my bookmarklet to view any Strava route, activity or segment in 3D, here is the follow-up post about a far more simple bookmarklet that will swap out the default Google Maps found in the Strava website for a choice of Open Cycle, Landscape and Street Maps or the Ordnance Survey maps in the UK. At least here in the UK the Google Maps can be rather limiting from a cycling or running perspective due to a distinct lack of detail, particularly around off-road routes. Fortunately the Open Maps (and even more so the Ordnance Survey maps) have detail in spades and with a bit of JavaScript magic we can swap out the Google Maps for the alternative map of our choosing.
3D Strava/Garmin Connect/Ride With GPS Courses, Activities, Routes and Segments
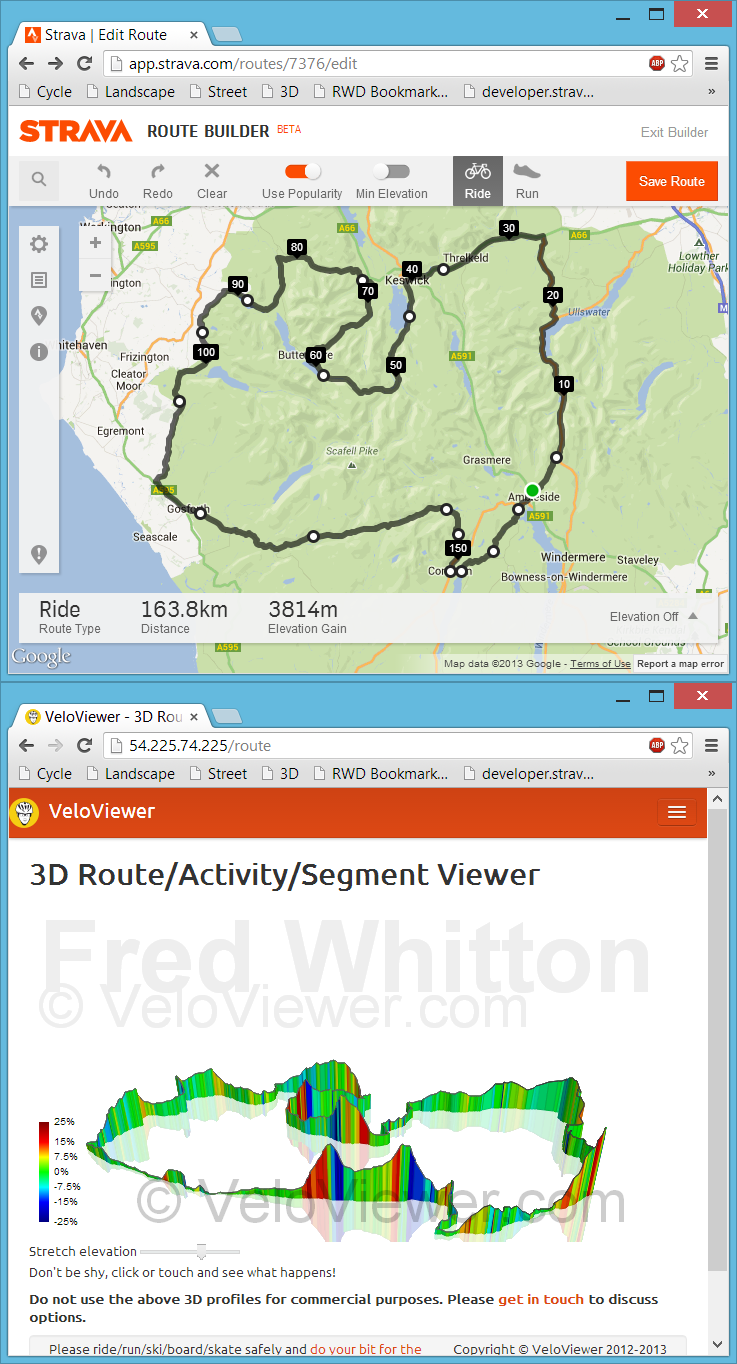 Back in July I had my first experience with bookmarklets when playing with Marc Durdin’s excellent bit of code that provides his funky elevation profiles for Activities and Segments right there, in amongst Strava’s own page contents. I might have been a bit naive but I just didn’t realise that this thing was so easy to do, so time for a quick play and see what I could come up with. First off I wanted to get an interactive 3D view of the new Strava Routes, the other thing that sprung to mind was to see if I could swap out the Google Maps view for the more detailed (at least here in the UK) Open Street/Cycle Maps which I’ll go into in my next blog post.
Update: unfortunately this approach to getting data for the 3D viewer is remarkably unstable due to the ever changing code at each of the sites mentioned above. Currently I think all of the sites listed have changed their code sufficiently for my code to no longer work and I’m not going to attempt to maintain it. Instead I’ve added a GPX import option on the 3D routes page but it does rely on the GPX file including elevation data. The GPX export from Strava doesn’t so that won’t work so the best site I’ve found so far to create your GPX files is Ride With GPS. The elevation data isn’t the best though so don’t expect very good profiles (Garmin Connect appears to have the best elevation data right now but there is no GPX export!). Of course if you’ve ridden the route then just view your activity on VeloViewer and you’ll see a 3D view there.
Interactive 3D Elevation Profiles
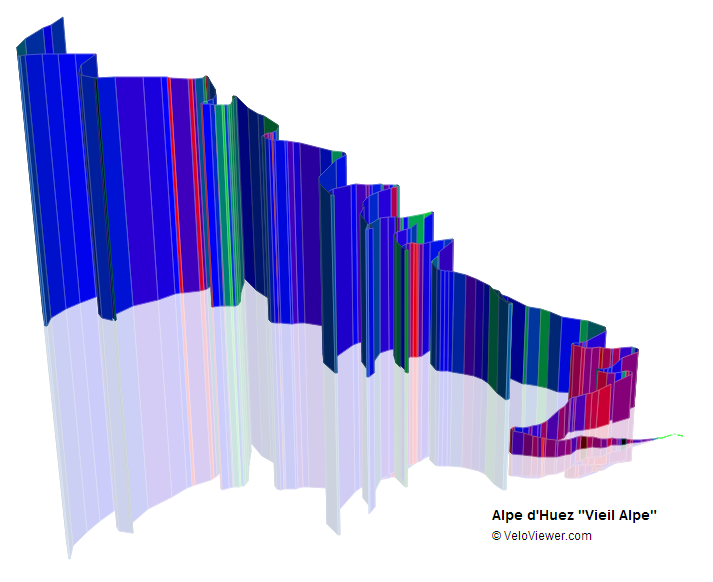 This is something I’d been wanting to do for ages and I’ve even surprised myself with how well they’ve turned out! The majority of elevation profiles you see around the cycling world look like they were drawn in the late 1990’s so it was time to bring them up to date and make the most of the latest technologies to allow you to interact with them.
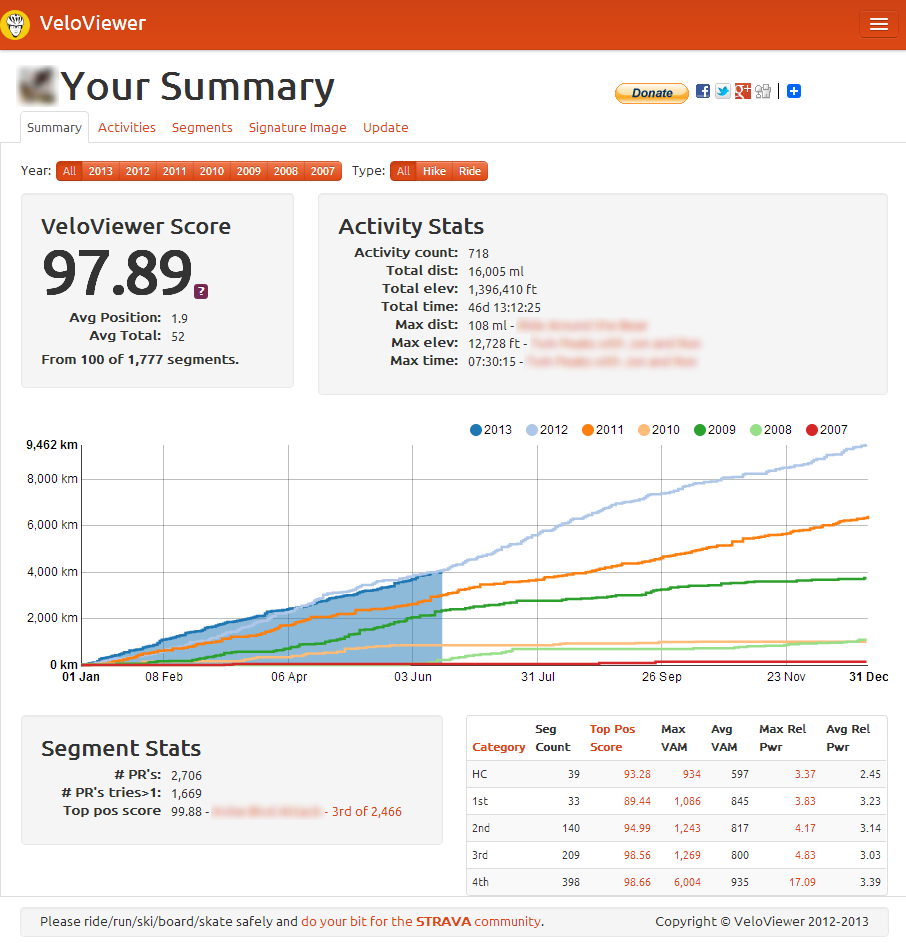
VeloViewer Score – How Do You Measure Up?
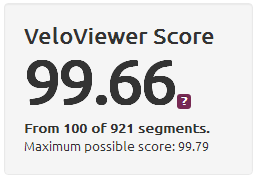 The VeloViewer Score is a composite measure providing a single value that represents your best Strava achievements. This value can then be used to benchmark yourself against any other VeloViewer user around the world. In this post I’ll explain how it is calculated and where your Score fits in against other VeloViewer users.
Understanding Strava’s Enhanced Privacy Mode
 Over the last year I’ve had a number of people getting in touch (along with a couple of my own club mates) saying things along the lines of not needing to set up a Privacy Zone to hide where they live because they are using the Enhanced Privacy Mode in their Strava settings. This is not the case. The only ways to hide you home’s location on an activity will be by using a Privacy Zone, marking your activity as private or not uploading them to Strava at all!
VeloViewer V3 is Alive and Kicking
 The blog has taken a bit of a back seat of late as I’ve attempted to get as many of the pages migrated across to the new Strava APIs as possible. The previous version of VeloViewer was around a year old and had grown slowly over that period and the replacement version will follow a similar path. Currently only the VeloFlow screen isn’t able to be migrated due to a few missing options in the new API but the majority of the rest of the site (and more) will be coming back on-line over the next few months. Where possible I will be improving those pages as I migrate them and also adding some interesting new features. As it stands I’m rather thankful that I have managed to get access to the new API as it seems a large number of people in a similar position to myself haven’t and it looks like that is how it will be for the foreseeable future.
What’s coming in Version 3 of VeloViewer
The Strava web services which are the backbone of VeloViewer are set to be replaced in the very near future with a much improved set. These new API’s will open up a huge amount of additional data to what I’ve had to play with previously and I’ll finally know who is actually visiting the site and display or hide data appropriately, First up though is a video I’ve put together of the new Activities page I’ve been working on that shows the new, very interactive cross-filtering functionality integrated with a new activity summary map. Sorry for the very poor narration skills:
Hopefully you’ll understand how these filters will work and how powerful they’ll be for you.
Save the VeloFlow API!
 As most of you will know Strava is moving to a new and improved version of their API (the way I get all my data from Strava to populate VeloViewer) and I’m currently working on VeloViewer to use this new version of Strava’s API. In general we are all going to be very excited by what the new API will offer us and I’ll go into that very soon in another post, but there is one sad bit of news – the main API that drives VeloFlow will no longer be available 🙁 This will mean that I will not be able to get the list of rides to display and I can’t think of another way to do it. So, the only hope I can see to keep VeloFlow going is to get all you good people to vote up and comment on my request to save the API on the Strava support site to show Strava how much you all want to keep VeloFlow running.
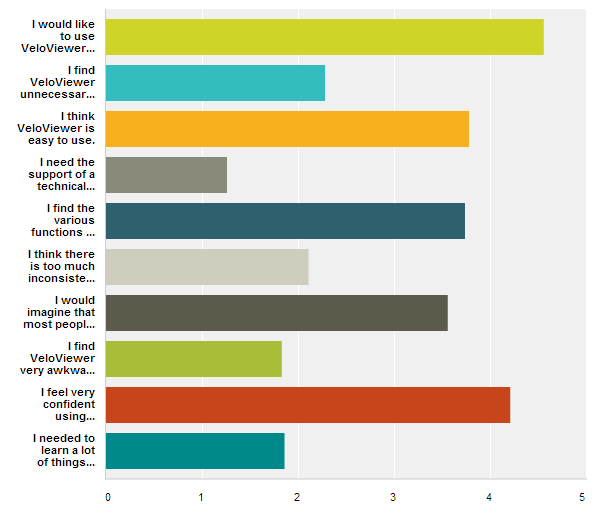
VeloViewer Usability Survey – The Results!
A massive thank you to everyone who took the time to fill in the usability survey and for those that added some comments at the end. VeloViewer’s final SUS score is 76.3 (out of 100) and here is how the responses averaged out:
VeloViewer Usability Survey
 To continue the underlying driving force for VeloViewer (a playground for ideas for my day job) I want to try out a usability review of the site which I will then attempt to get my employers to embrace for their own products. For this I’ll be using the well proven System Usability Scale (SUS) that is made up of 10 very simple questions which can provide a great measure of usability for a website (or app) that can easily be bench-marked against any other sites (or apps). The survey should take less than 2 minutes to complete and is just 10, simple, multiple choice questions. A huge thank you to those of you that do take the time to fill it in.
Take the survey by clicking here! – Survey finished. Thanks for your feedback.
In a few weeks time I’ll post the results and show how it compares to other sites. I might run a similar survey for your views on the Strava site, you’d hope they would score a fair bit better than VeloViewer!
There will be a number of changes to VeloViewer as I swap over to the new Strava API’s during which I will attempt to improve the usability where I can, especially around the update page. I’ll post a blog entry soon as to what those changes are likely to be (for better and worse) when I get chance. Once the next version is live and in use I’ll run another of these surveys to see if the perceived usability has improved.