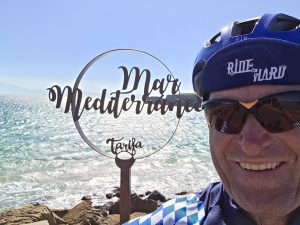
 Regular followers of our Tiling Tales series will recognise Jürgen Knupe as an avid tiler who is renowned for his Panamericana Bikepacking Trip.
Out of the gate in 2026 Jürgen already has a story to tell completing his ‘Spanish cluster corridor’, resulting in him taking top spot in the MaxClusterSpan Leaderboard.
Uncover the story behind Jürgen’s adventures and get inspired for the season ahead with our Q&A. Continue reading
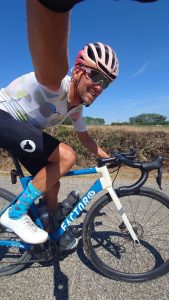 We are fascinated by the diverse goals of VeloViewer users, with every story revealing unique and inspiring dedication to personal achievement. Tiler Stephan van Hienen caught our eye when he casually dropped in a 2861 day cycling streak with his 2025 yearly infographic on Instagram.
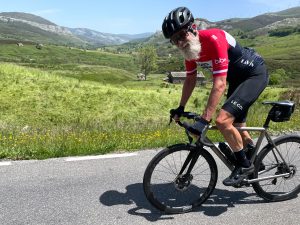 VV Wrapped season has unearthed some phenomenal stories of rider achievements. One which we were keen to do a deep dive on was Robert Williams who chased 100 imperial centuries and hit 107 in 2025. This amazing achievement gives him an Eddington score of 100+ which is spectacular. Not only this, the icing on the cake for Robert is hitting 524,076 metres elevation for the year.
 We have had our eye on the tiling adventures of Dutch rider
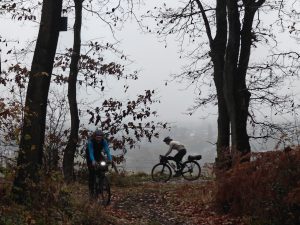

 With over half of 2025 completed, VeloViewer infographics are starting to look pretty as they tell a story of riders adventures for the year to-date. Our end of year VV Wrapped is renowned for being shared in the new year and is a visual way to depict the year of training.
  Our VeloViewer Wrapped Infographic stories are inspired by users who shared their data with us and their goals for the year.
 To kick off the VeloViewer infographic season we caught up with Grace Brown, Australian road racer and World Champion. After an epic season which saw her win Liege-Bastogne-Liege, and the Olympic and World Championships time trial, we were keen to review her infographic which visualises her stats for the year.
  Discover how British explorer tile hunter and