 Discover how British explorer tile hunter and Vicar Graeme kept the faith to secure precious VeloViewer Explorer Tiles by using the currency of chocolate and the powers from above!
Over to Graeme…..
Discover how British explorer tile hunter and Vicar Graeme kept the faith to secure precious VeloViewer Explorer Tiles by using the currency of chocolate and the powers from above!
Over to Graeme…..
 Our favourite emails to receive are from VeloViewer subscribers with tales of their explorer tile hunting. We’re always shocked at the lengths people go to, but also inspired by adventure seekers who find new ways to claim a tile, along with the buzz it gives them!
We were contacted recently by British Columbian Anna Bonga who shared details of her and her husband’s mountain biking adventure with the sole focus of collecting tiles. The journey involved riding, climbing and bushwhacking through prickly bushes and alongside downed trees, whilst also carrying ice axes just in case the soil gave way and they needed to pull themselves back up the slope! Continue reading
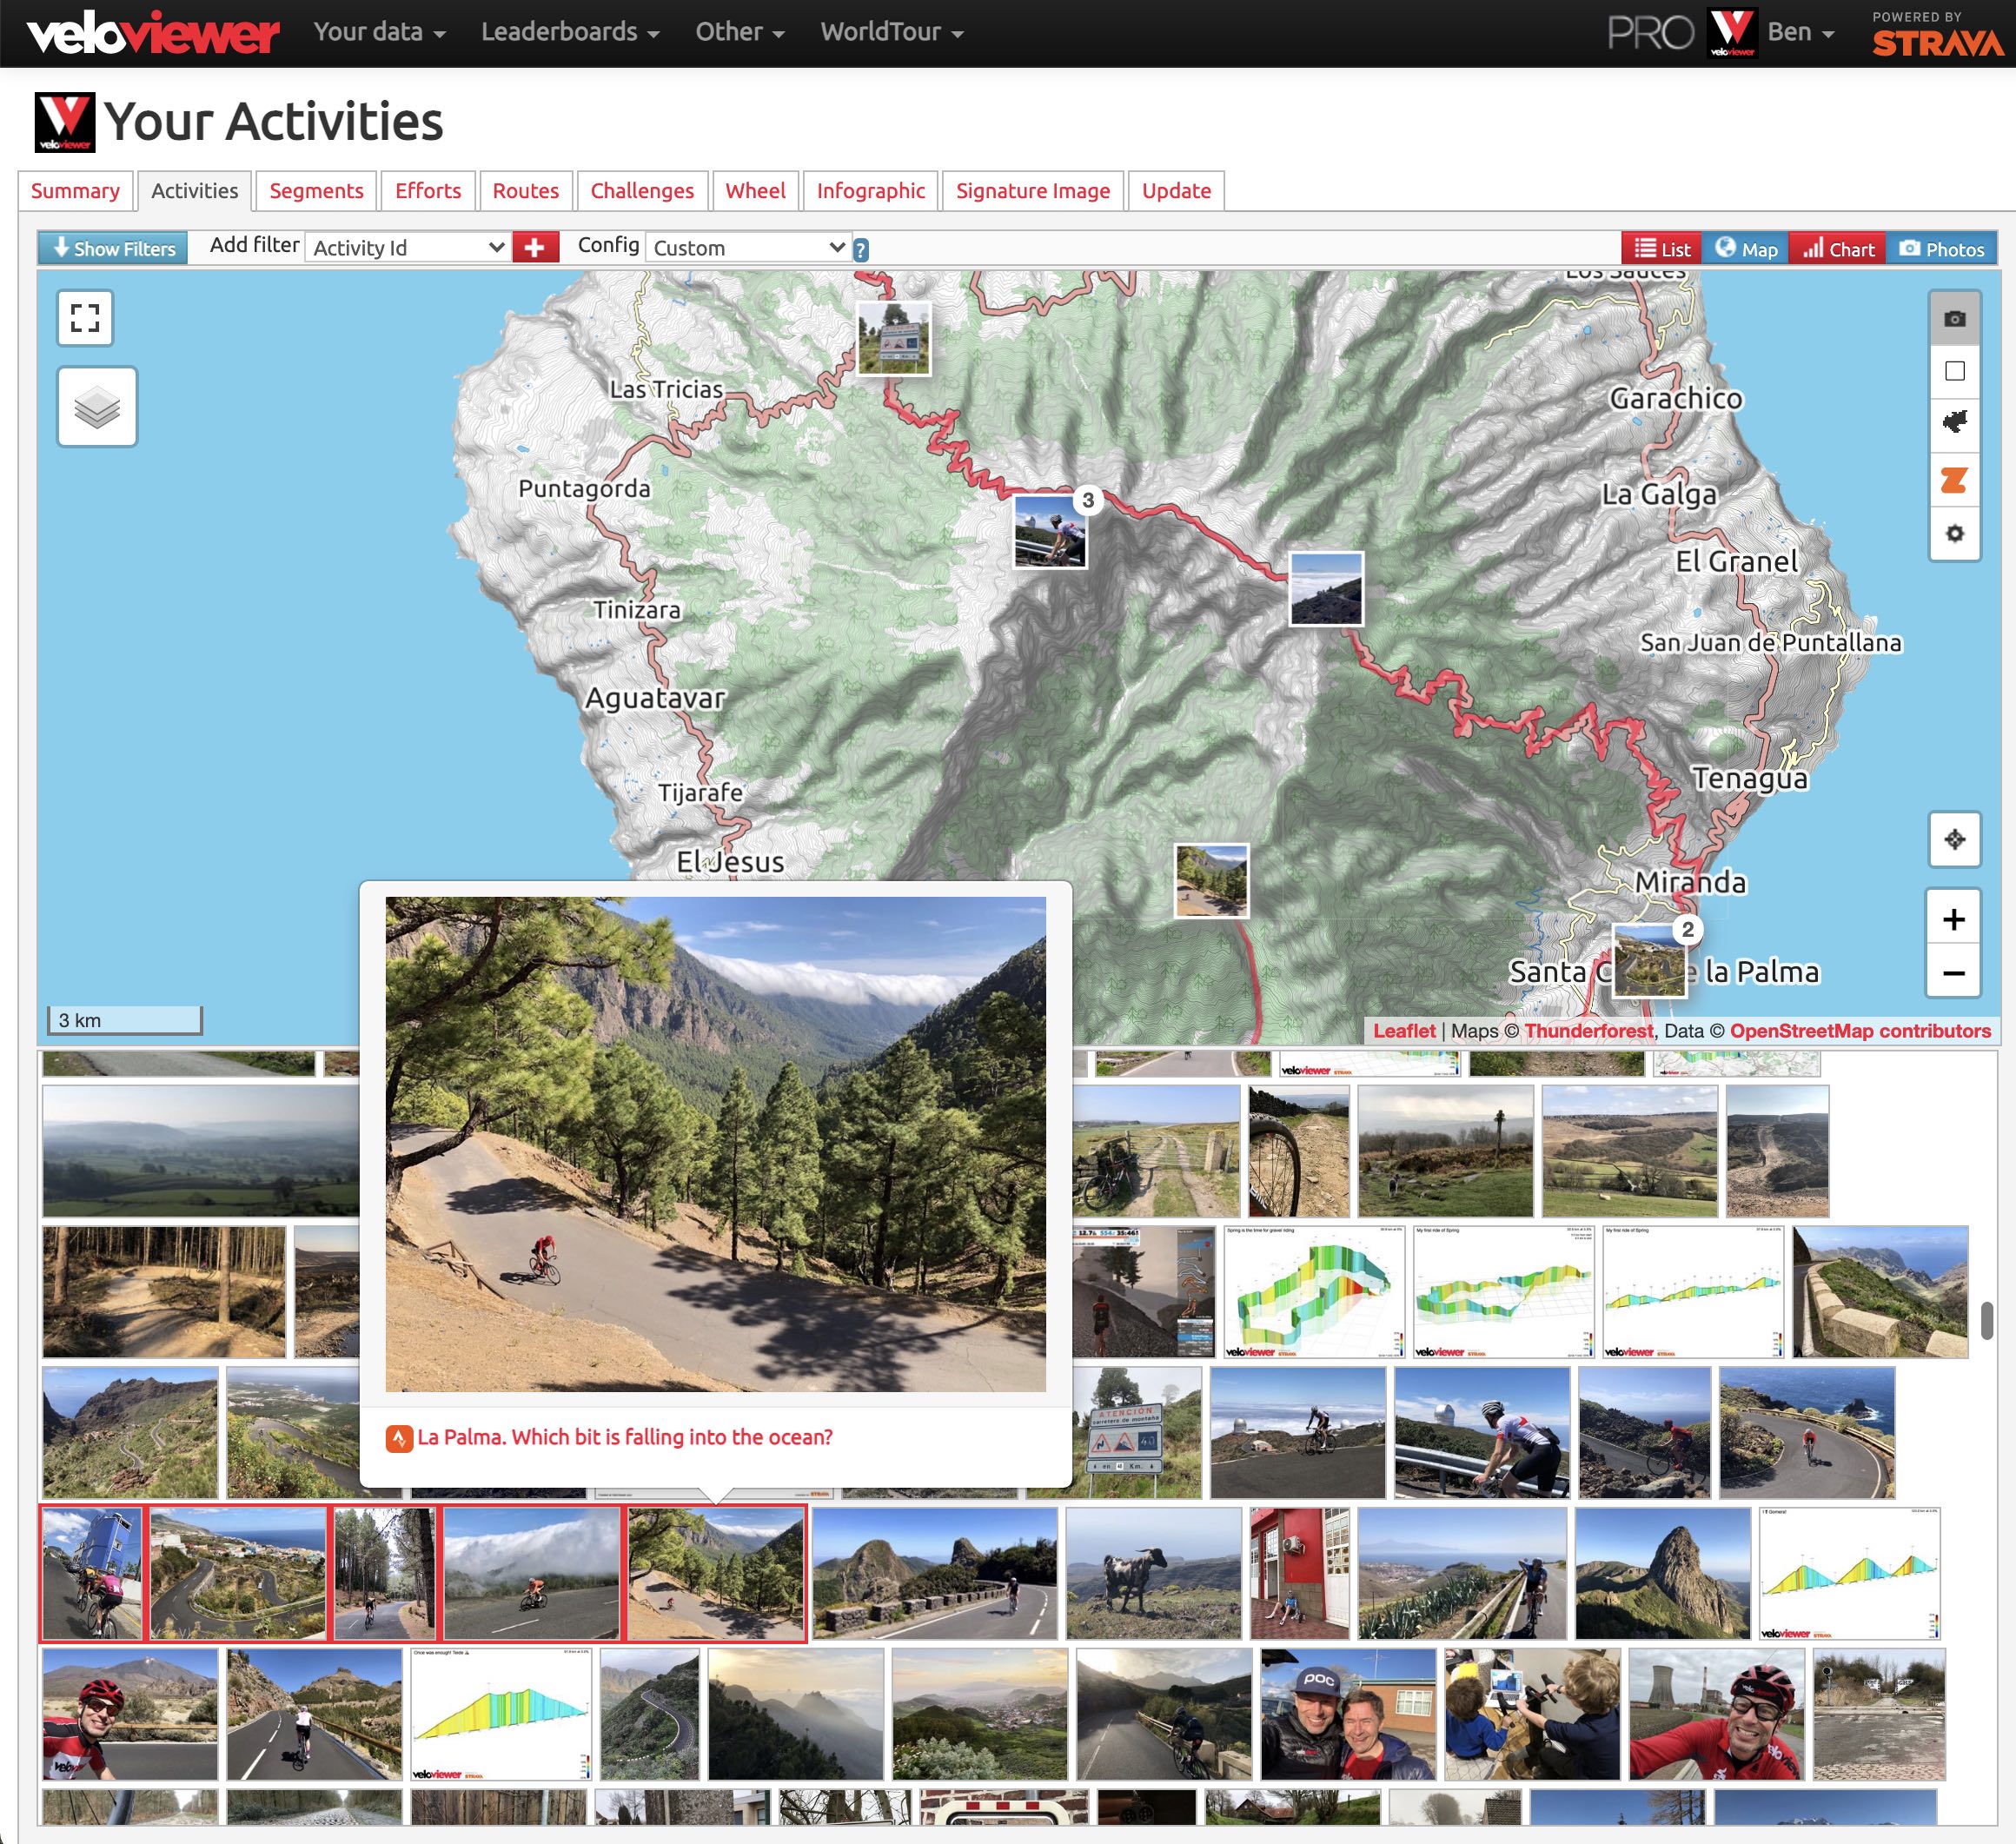
If you are anything like me then looking back at photographs from past adventures brings all of those feelings rushing back. Whether it was of that ludicrous ride where you bit off far more than you could chew (I blame Simon Warren for most of those) or that image of the fantastic cafe stop when chewing was the highlight. With the integration of your Strava photos into VeloViewer you can now browse through all of your exploits on the map or thumbnail view with the added benefit of VeloViewer’s activity filtering to quickly narrow down the photos you want to see.
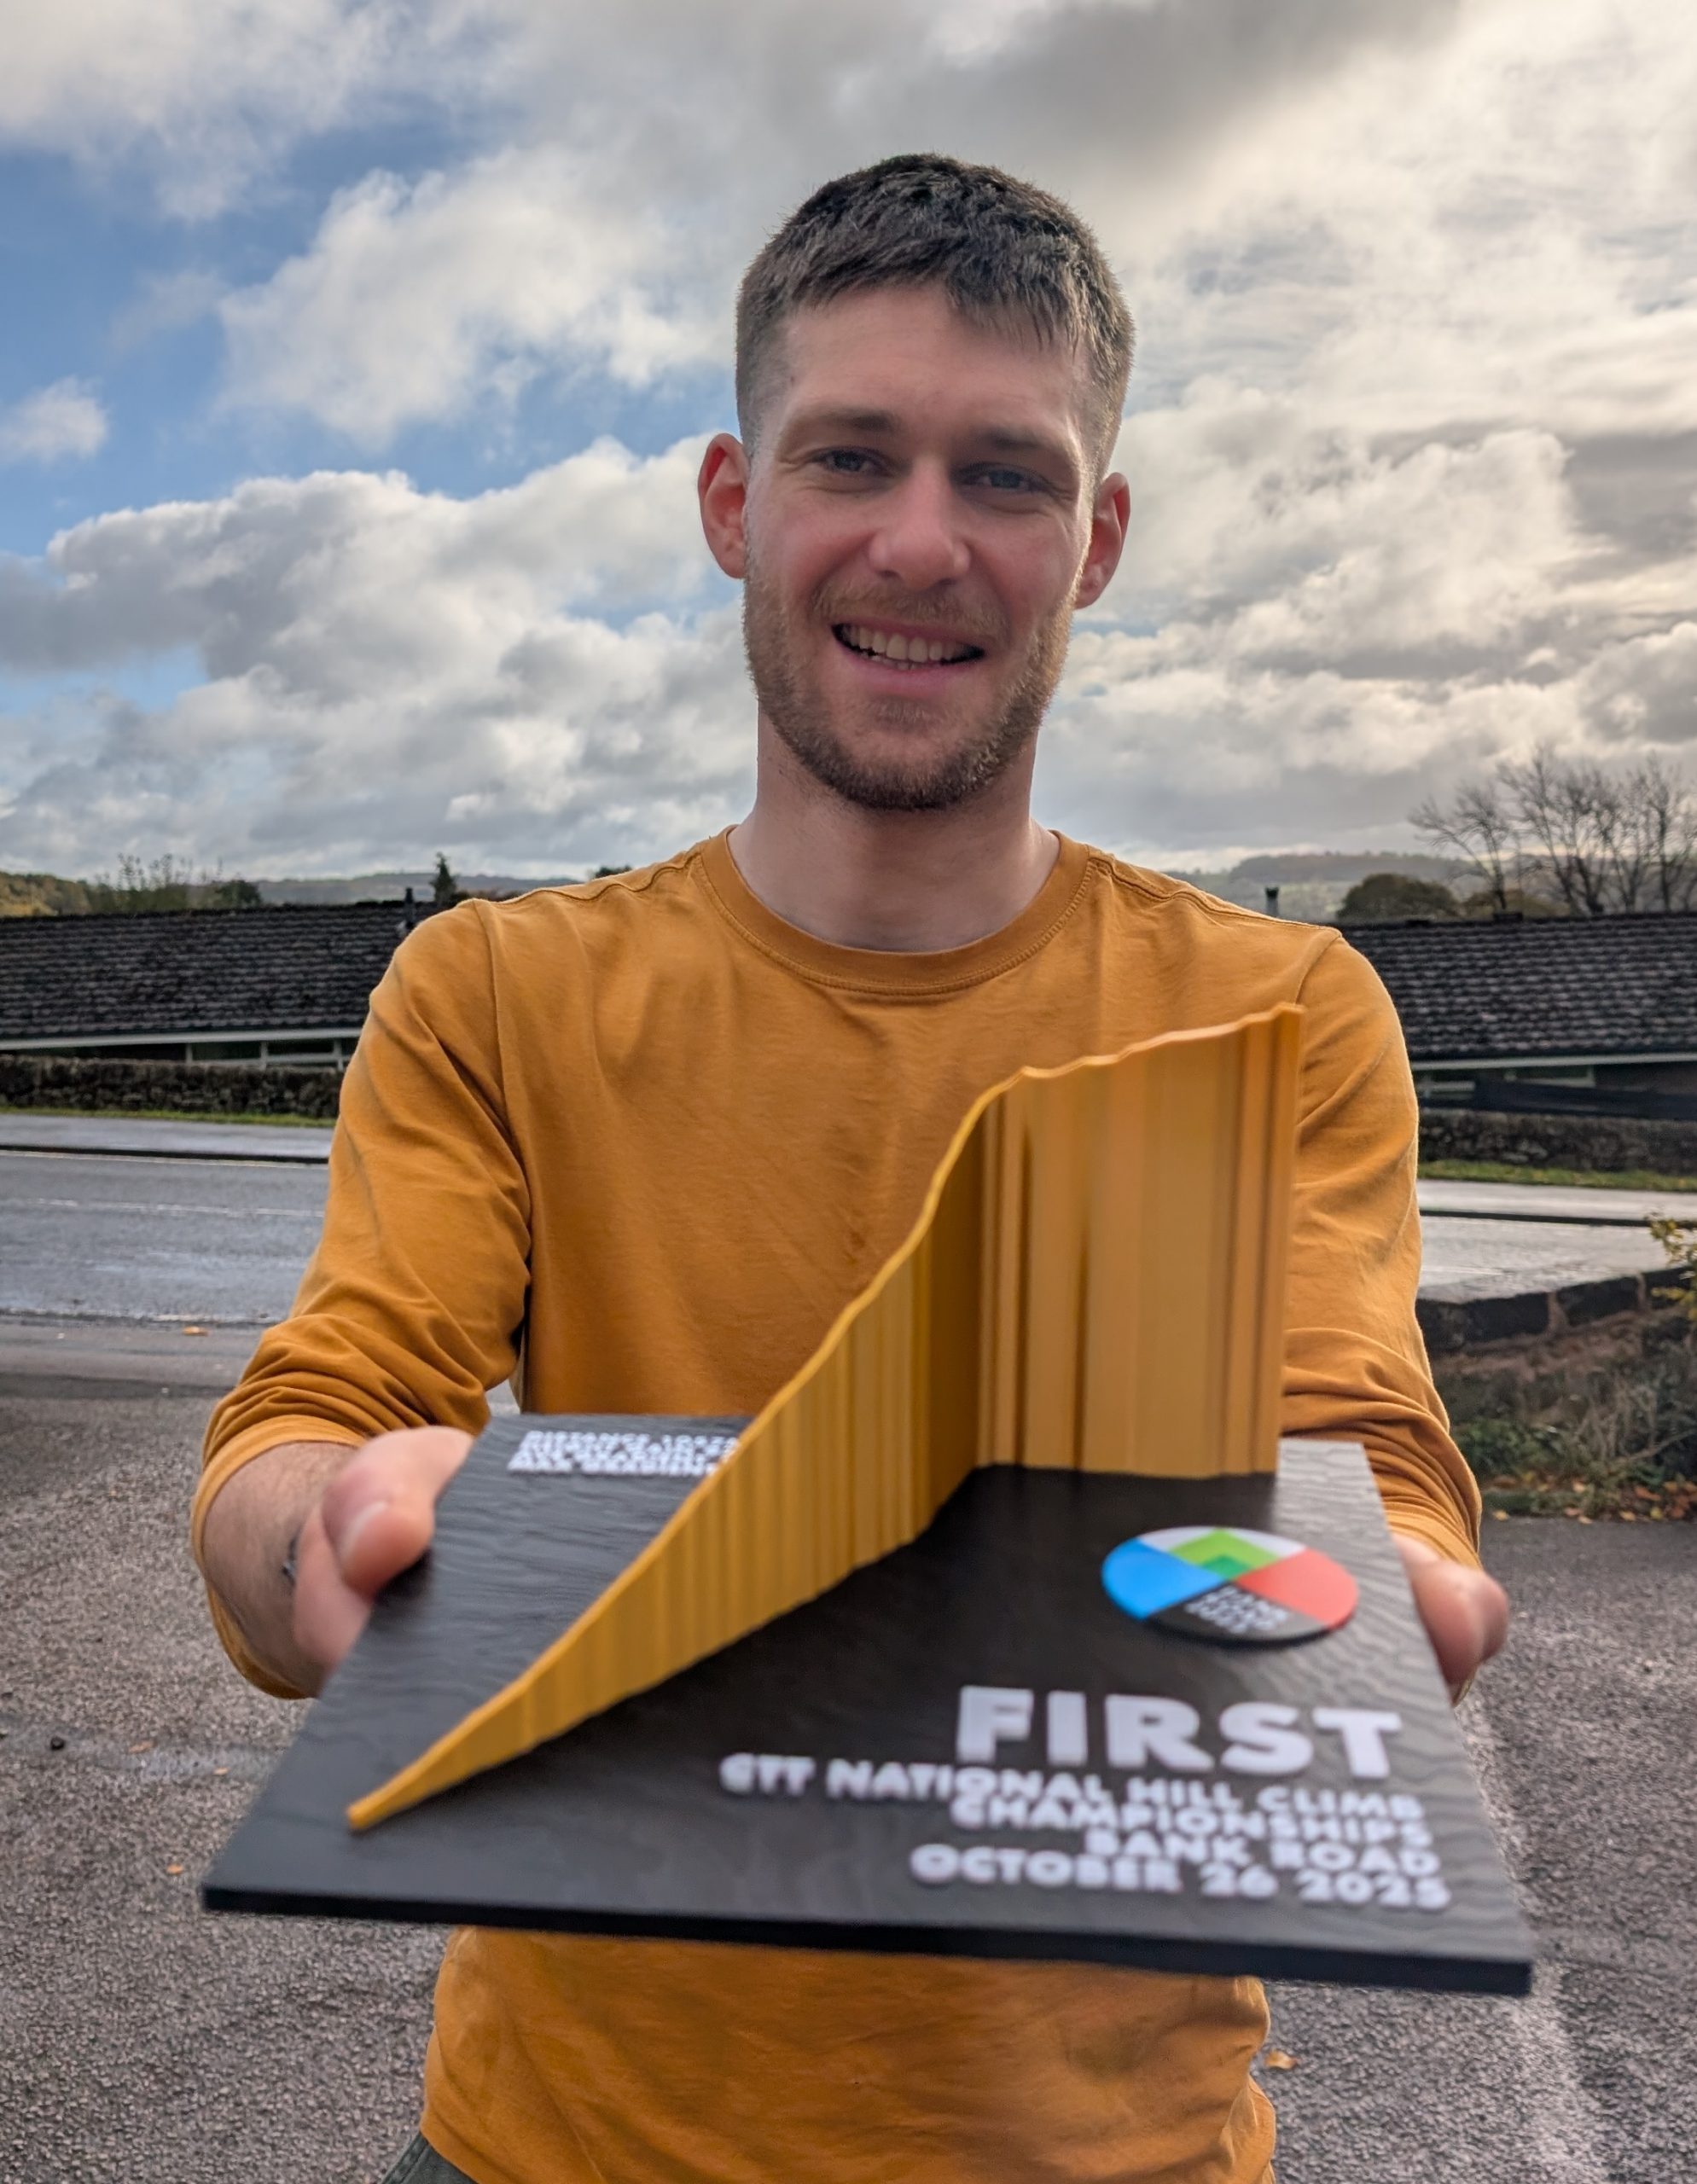 I’m sure most of us have had rides, runs or hikes that we’re proud to have completed and what better way to show them off than a funky 3D print of the profile. Over the last few years I’ve had numerous conversations with my riding mates about the possibility of doing 3D prints and although they all had fancy 3D printers at their disposal at their engineering jobs, it never got further than that. Fortunately PrintMyRide stepped up providing this service so now I’ve coded things up so you can easily send your activities, routes and segments straight over to PrintMyRide direct from VeloViewer wherever you see a 3D profile.
 I’ve had numerous requests to build-in the ability to add images to activities from the browser rather than having to use the native phone/tablet app. It can often be a pain having to transfer photos to the phone before adding them to the activity or a complete blocker for people that don’t use an iOS or Android device at all. A while back I added the ability to add your 3D and 2D profile images direct to your activities using the button on your Activity Details page so I thought it was about time to open it up a little further.
Continue reading
 Since the introduction of the Explorer Score and Explorer Max Square there have been requests for some sort of metric to represent the maximum number of connected Explorer tiles. The recent improvement in the calculation of completed Explorer tiles sparked a very active discussion which resulted in the refinement of the concept and the creation of the Explorer Cluster. The Explorer Max Square provides a hard-core challenge but can be tricky for people who live in geographically challenging areas or have key tiles which are completely inaccessible. This is where the Explorer Cluster looks to provided a more level playing field.
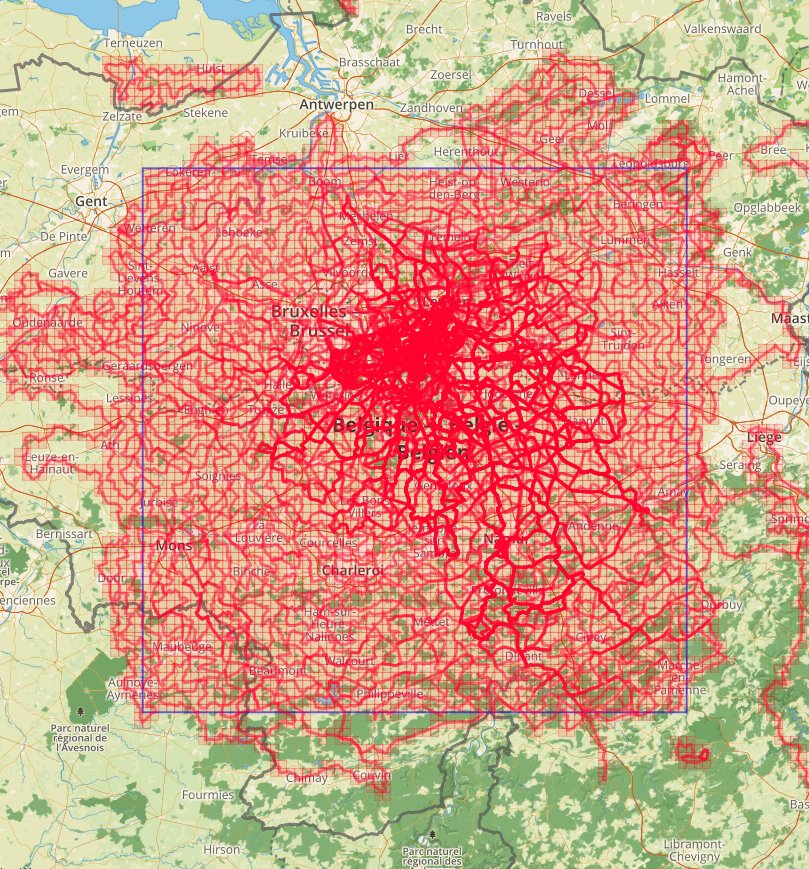 The Explorer Max Square leaderboard has brought together a small but remarkably dedicated international community of riders taking in new roads and trails at every opportunity in order to increase their Explorer Max Square. What drives them to ride across frozen lakes, attempt to access military bases and buy opera tickets to tick off map squares? Let’s ask them!
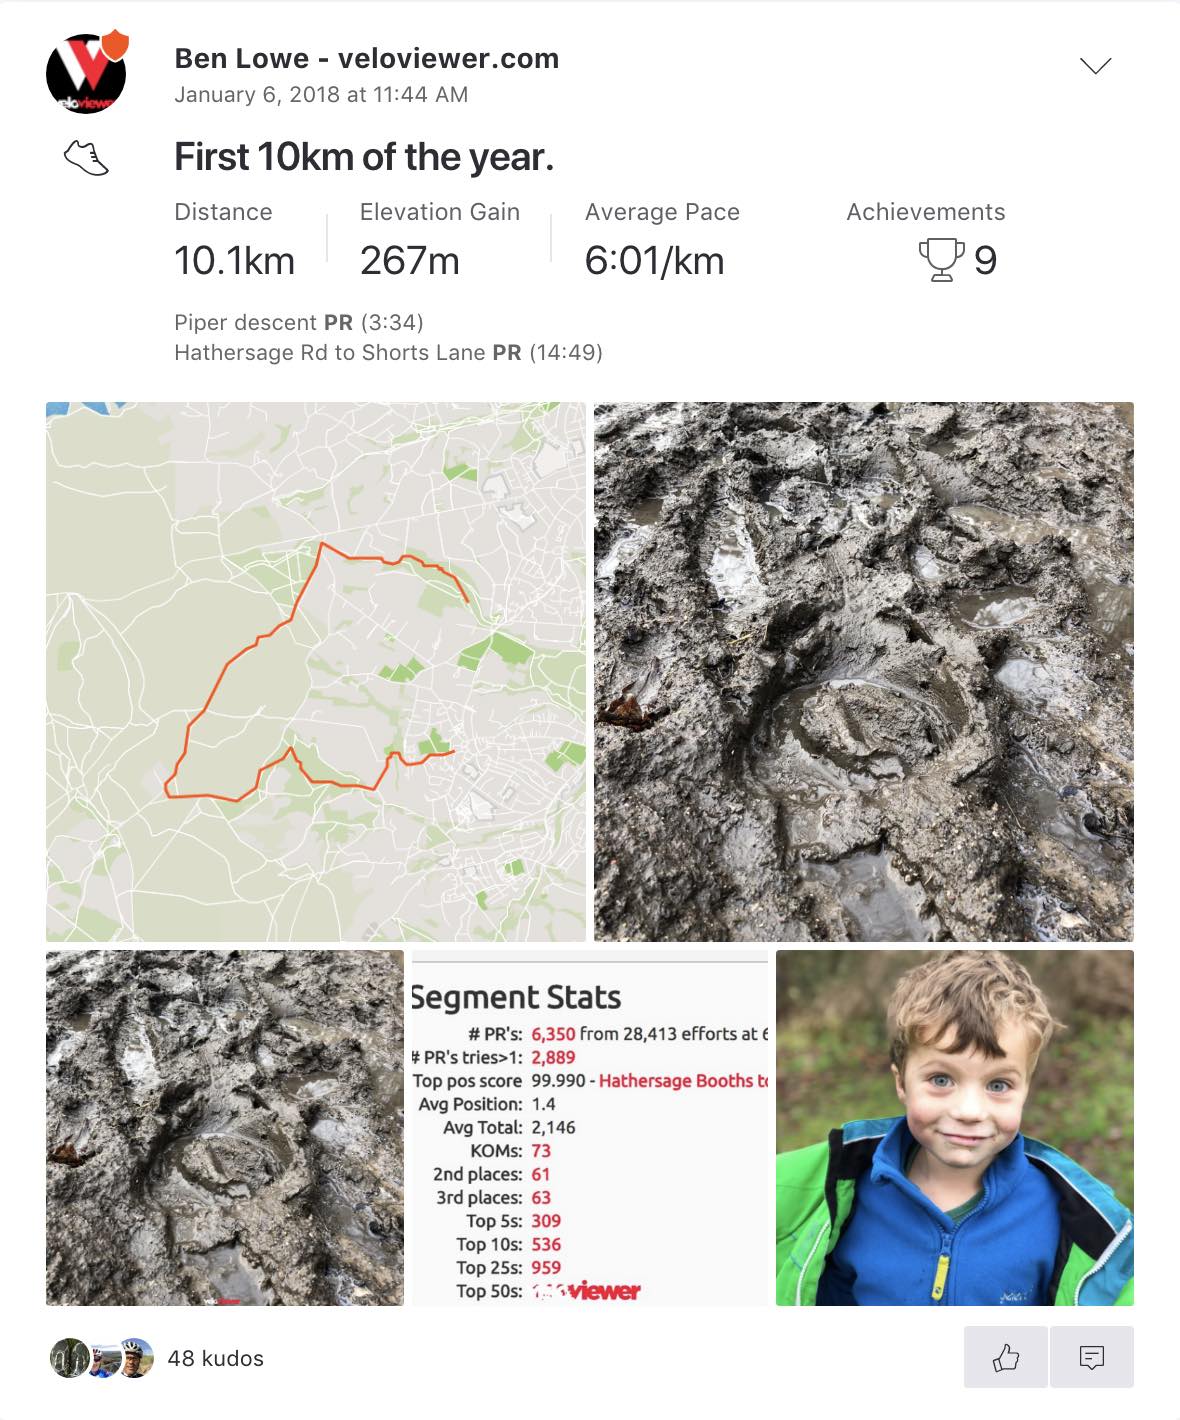
 Strava has long had the ability for you to add photos to your activities to provide a much more engaging account of your day for your friends as well as for you. On the mobile apps the “Highlight Photo” is shown in place of the map in the activity feeds making your ride/run stand out from the list. Previously the process of getting a VeloViewer 3D or 2D profile picture onto your activity was fairly laborious but now you can click a button and it will magically appear.
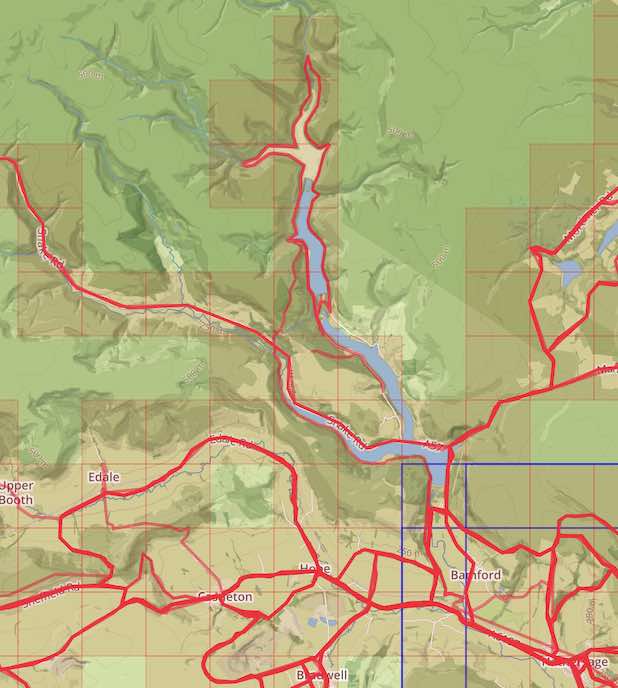 The VeloViewer Explorer Tiles and more specifically the Explorer Max Square has acquired a bit of a cult following since its introduction to the site back in March 2015 despite me not having fully explaining what it is all about until now! The Explorer Score rewards those people who explore new roads/trails rather doing the same old loops. Providing non-performance based motivations has always been one of the main goals of VeloViewer and this one really looks to tick that box.
In summer 2015 Garmin introduced Live Strava Segments and since then both Mio and Wahoo Fitness have also introduced the feature to their recent devices (full list of supported devices). Currently the Garmin devices are limited to bringing in just 100 of your starred Strava segments. This resulted in a number of VeloViewer users asking for a quicker way to manage their starred segments when planning trips away as they were going beyond that 100 segment limit. Strava kindly opened up their API for starring segments so I’ve added in the ability to star and unstar segments in every possible location in VeloViewer to make life a bit easier for you.
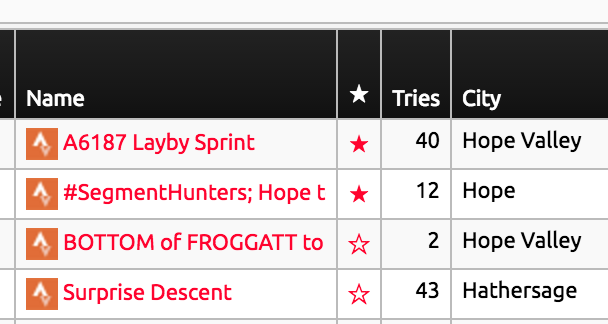 Wherever you see the star next to a segment you can now press it to toggle its starred state. These locations are:
I’ve also added a count of your currently starred segments to your Summary page in the header of the “Segment Stats” section which links to your segment list passing the filter to show just the starred segments.