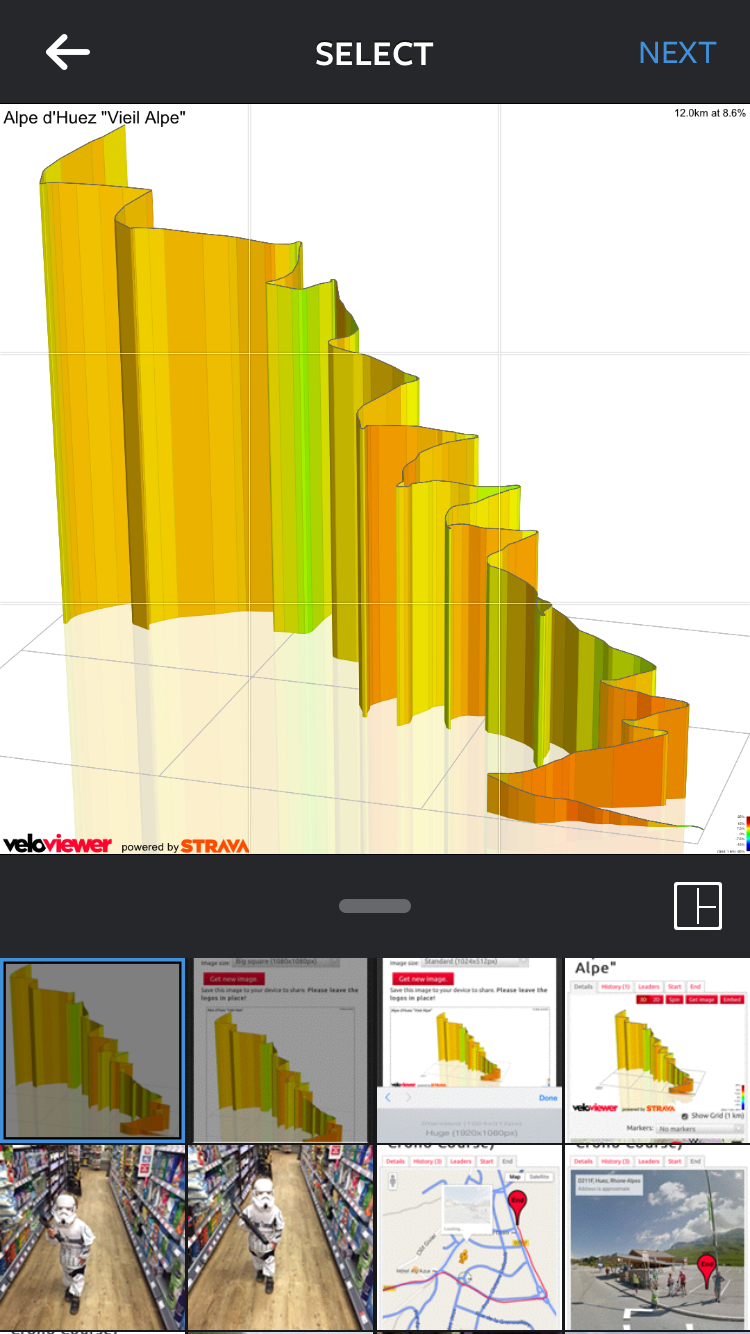
 Hopefully lots of you will have seen the 3D profile images being showcased on Eurosport throughout the Tour de France coverage this year. I have now massively improved the way you can get hold of your own 3D profile images of rides, runs or segments to make it much easier for you (as well as me) to attach to your Strava activities or share on social media from your phone, tablet or PC/Mac.
Category: Activities
Getting your Power/Heart Rate FTP and Normalised Power from your Strava data
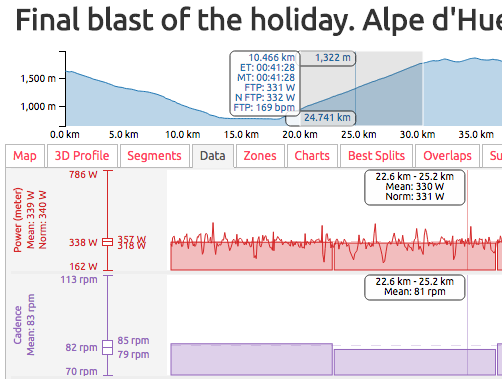 Finding your FTP (Functional Threshold Power/Performance) is a unavoidably painful experience but getting a number out the other end shouldn’t be, which is why I’ve tried to make that part of the process as simple and versatile as possible. Just sync your data from Strava over to VeloViewer and let VeloViewer do all the number crunching on your behalf. Instantly see your power, normalised power and heart rate based FTPs against all your segments or over any part of any of your activities including your best splits.
Continue reading
Déjà vu? Finding out if you’ve been there before
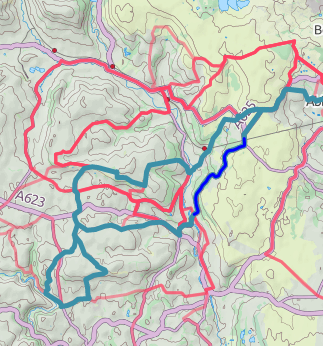 Segments are a great way to see how many times you’ve covered certain sections of road/track, but what if there are no segments set up for the stretch you are interested in? Say hello to the Activity Overlaps tab! OK, probably not the most sexy of names, but what it lacks in title it makes up for in functionality – select any section of any activity and it will search through all your activities and provide a list and map of any that overlap. Neat!
Delving into The Sufferfest Rubber Glove with VeloViewer to find your FTP
 Most of you by now will have tried out the new activity details page on VeloViewer but in the depths of a northern hemisphere winter, here’s how you can use it to find your Functional Threshold Performance (FTP) in conjunction with The Sufferfest’s Rubber Glove video from the comfort of your own kitchen/garage/cellar/gym.
Monthly Strava Activity Wheel
 Ever since I saw this visualisation of the 2013 Giro d’Italia route last year I’ve wanted to emulate that view, dynamically on my Strava data and luckily for you guys, let you use it too. Once I’d got my head around the maths for drawing the profiles on an arc then the rest quickly took shape. Isn’t maths fun!
3D Strava/Garmin Connect/Ride With GPS Courses, Activities, Routes and Segments
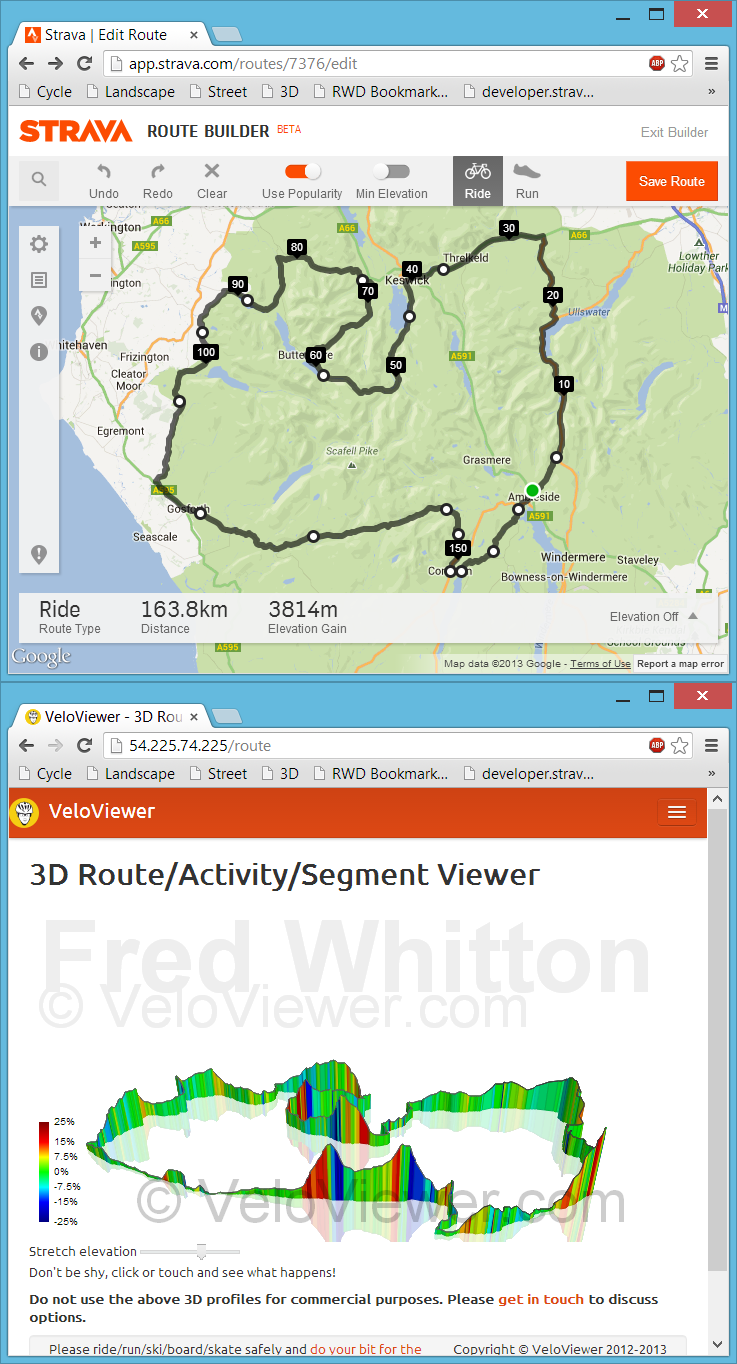 Back in July I had my first experience with bookmarklets when playing with Marc Durdin’s excellent bit of code that provides his funky elevation profiles for Activities and Segments right there, in amongst Strava’s own page contents. I might have been a bit naive but I just didn’t realise that this thing was so easy to do, so time for a quick play and see what I could come up with. First off I wanted to get an interactive 3D view of the new Strava Routes, the other thing that sprung to mind was to see if I could swap out the Google Maps view for the more detailed (at least here in the UK) Open Street/Cycle Maps which I’ll go into in my next blog post.
Update: unfortunately this approach to getting data for the 3D viewer is remarkably unstable due to the ever changing code at each of the sites mentioned above. Currently I think all of the sites listed have changed their code sufficiently for my code to no longer work and I’m not going to attempt to maintain it. Instead I’ve added a GPX import option on the 3D routes page but it does rely on the GPX file including elevation data. The GPX export from Strava doesn’t so that won’t work so the best site I’ve found so far to create your GPX files is Ride With GPS. The elevation data isn’t the best though so don’t expect very good profiles (Garmin Connect appears to have the best elevation data right now but there is no GPX export!). Of course if you’ve ridden the route then just view your activity on VeloViewer and you’ll see a 3D view there.
What’s coming in Version 3 of VeloViewer
The Strava web services which are the backbone of VeloViewer are set to be replaced in the very near future with a much improved set. These new API’s will open up a huge amount of additional data to what I’ve had to play with previously and I’ll finally know who is actually visiting the site and display or hide data appropriately, First up though is a video I’ve put together of the new Activities page I’ve been working on that shows the new, very interactive cross-filtering functionality integrated with a new activity summary map. Sorry for the very poor narration skills:
Hopefully you’ll understand how these filters will work and how powerful they’ll be for you.