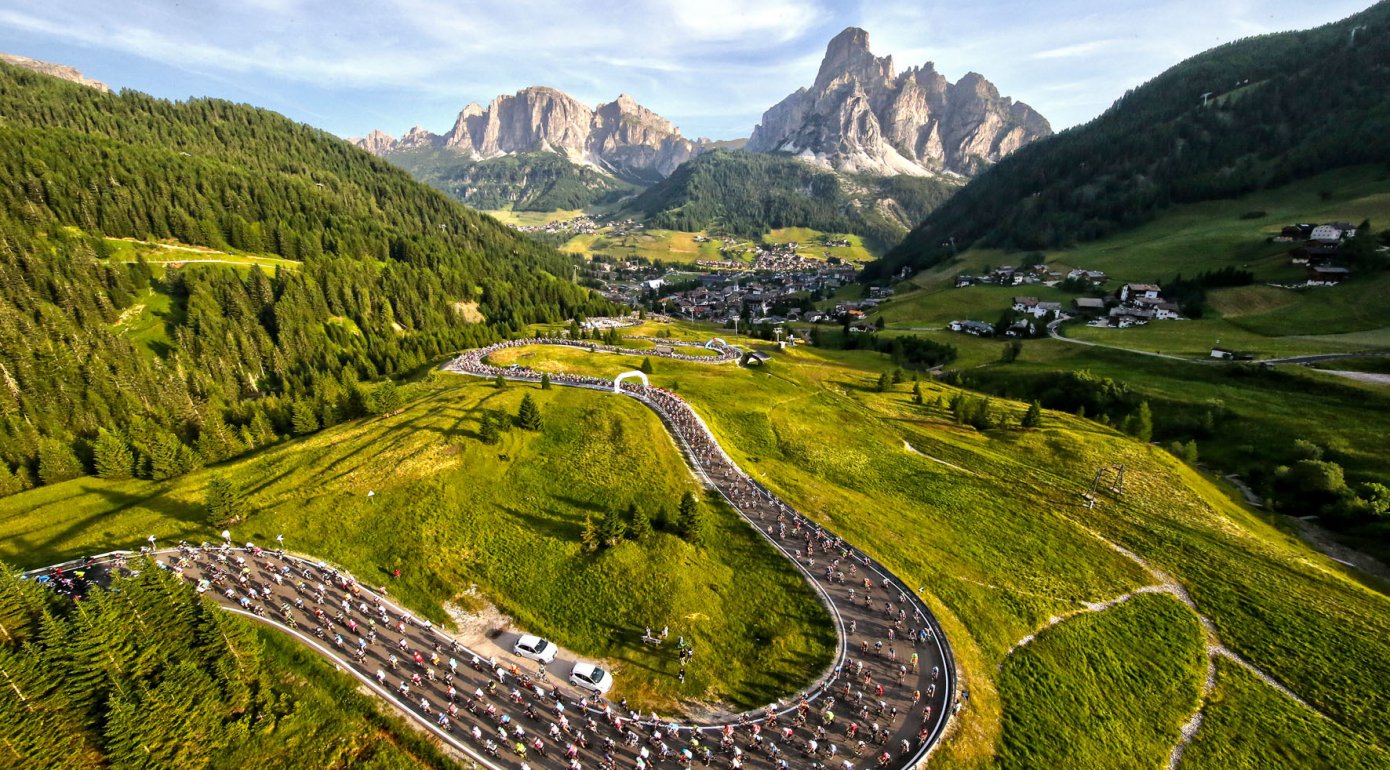
We’re getting our racing fix from the Southern Hemisphere this month, as the Santos Tour Down Under 2025 gets underway with the first WorldTour races of the UCI season.
The Tour starts and finishes in Adelaide, with the women’s 322.8 km over three stages, and the men’s race covering 1198 km over six stages, all set across South Australia where riders will take on challenging routes while battling the heat.
 We’ve all seen profiles of many climbs over the years and when looked at individually, taking note of the elevation gain and distance, you can get a good idea of the severity of the climb, especially when they are coloured by the gradient. If you show two of these profiles next to each other then because the elevation and distance scales are usually very different it is very hard to get a feel for how one compares to the other. Last year I tweeted out images of a few climbs sharing the same scales but had to do lots of manually resizing to get them to be correct. Now we have a built in way to compare any segment/climb with any other.
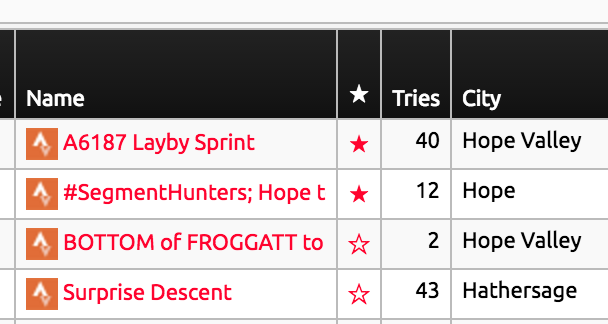 Wherever you see the star next to a segment you can now press it to toggle its starred state. These locations are:
 Kinomap
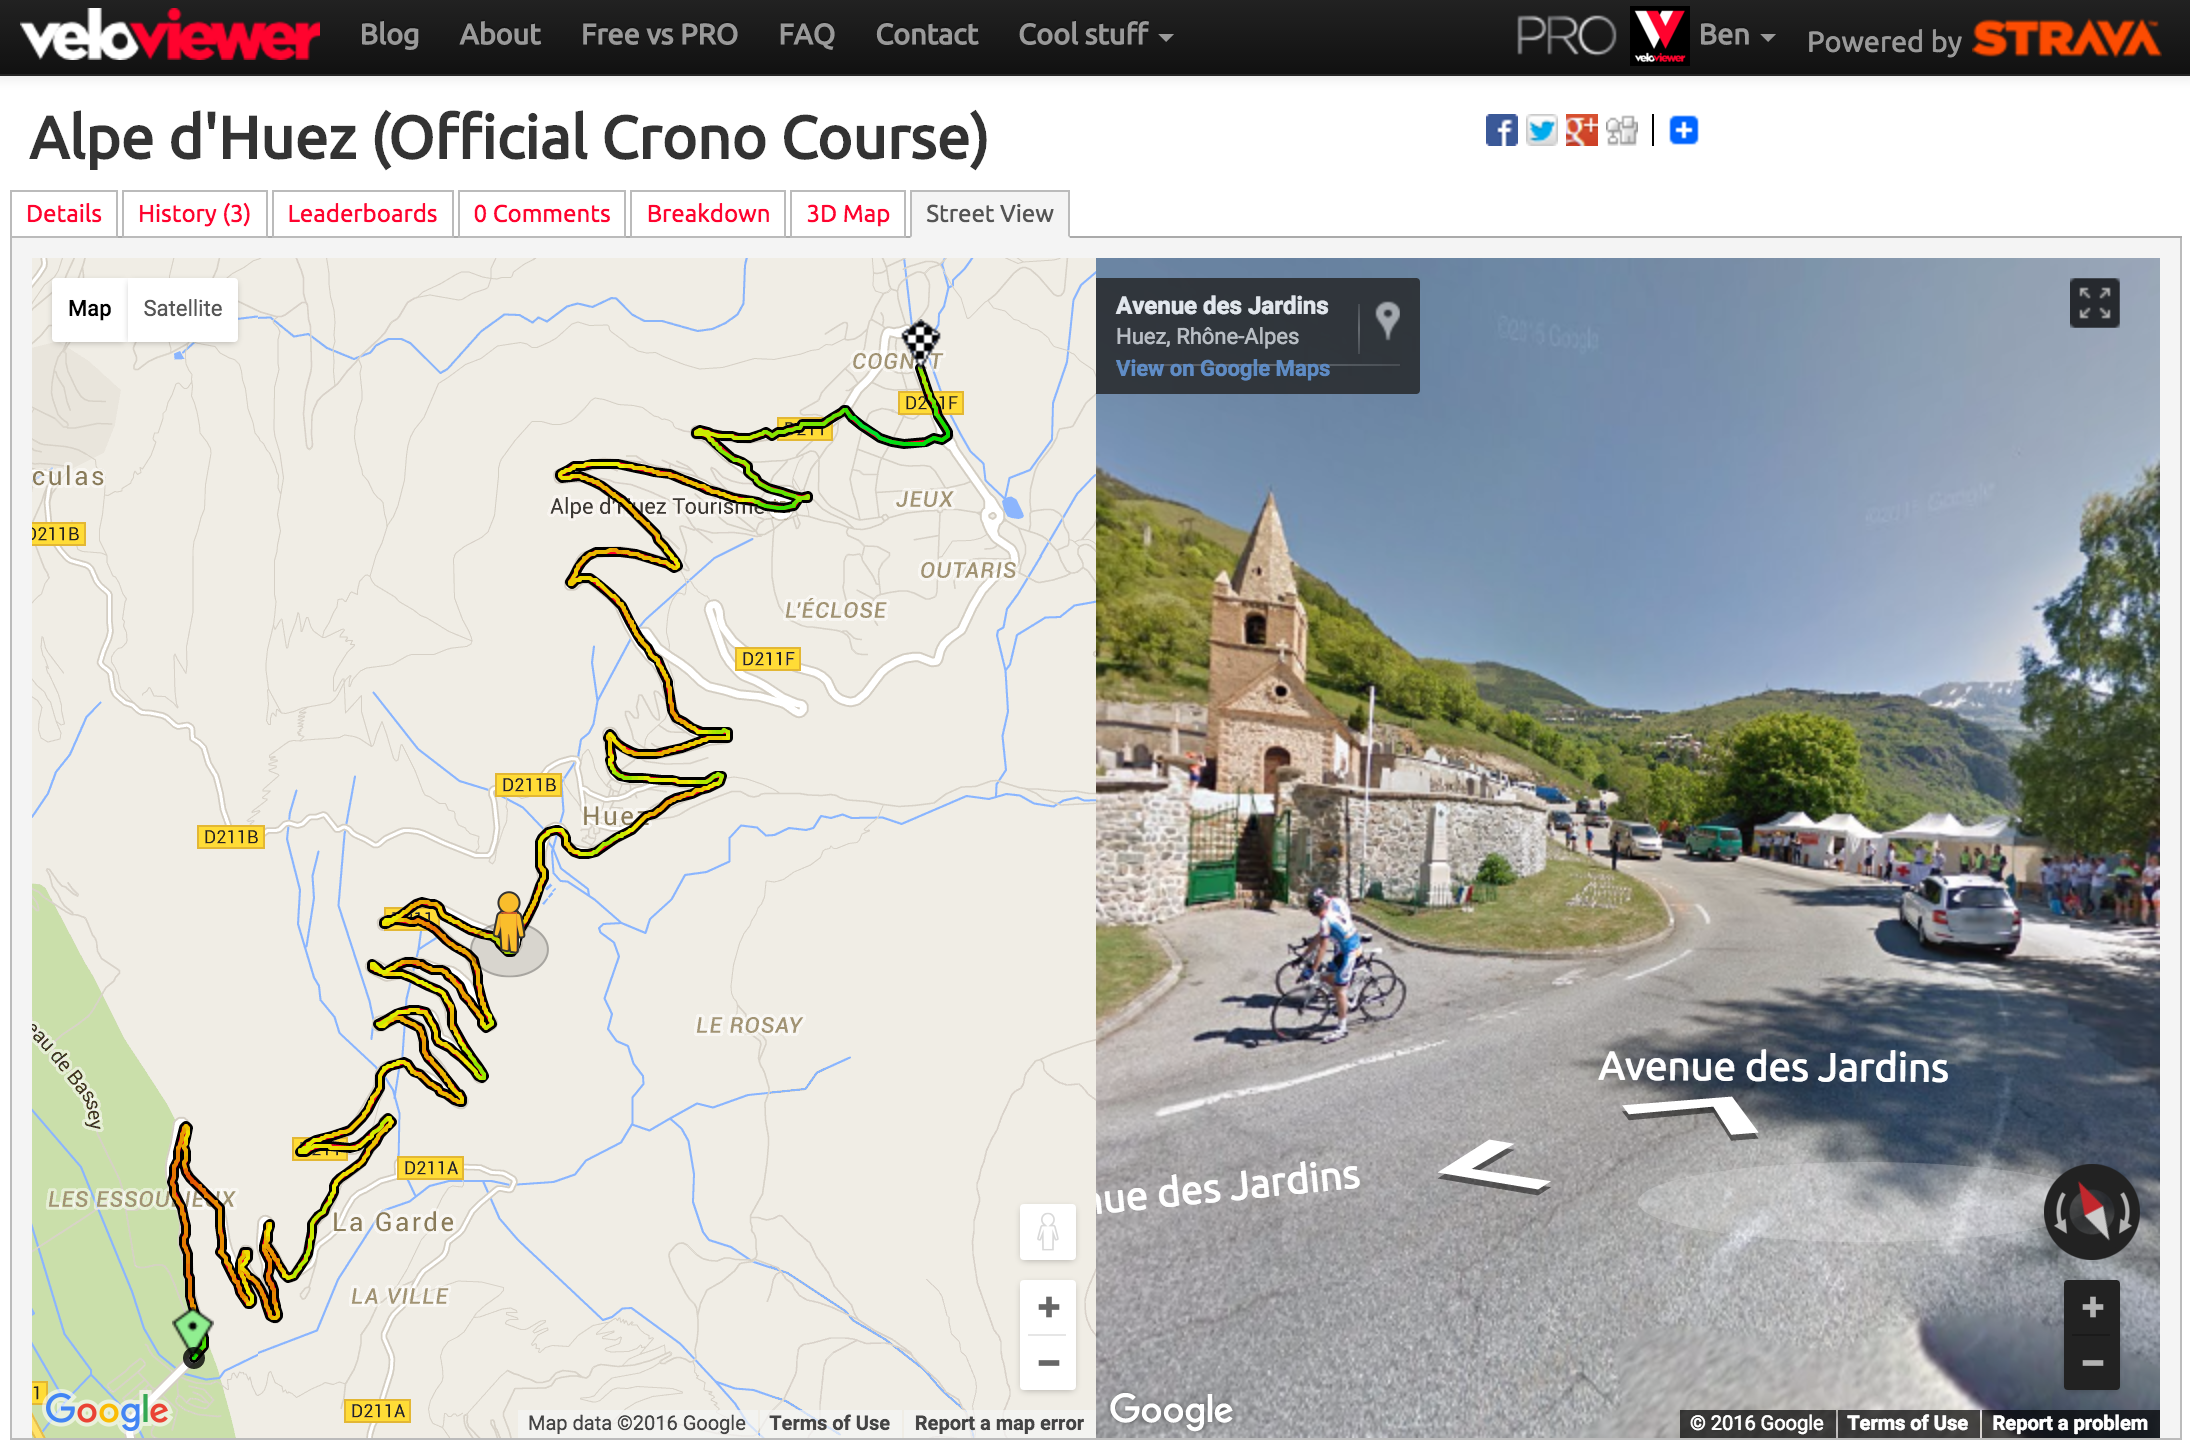 Although we’d all love to be out riding/running much more often, sometimes we’re stuck, looking at a computer, pretending to work. So to make that time as engaging as possible you can now reccy new routes, swot up on all the details of a segment or relive a ride/run from the past using the new/revised Google Street View integration on VeloViewer. Combine that with the new colour gradients shown on the maps and you get a fantastic way to explore the twists, turns, ups and downs.