 L’Etape du Tour is always a classic of an event but for 2017 the parcours is going to provide a really tough challenge. At almost 180km in length the route begins with a fairly relaxed first 120km taking in a scenic tour of Lac de Serre-Ponçon before tackling the Col de Vars and a tough summit finish of the southern slopes of the Col d’Izoard. Expect a few hours of crazy huge pelotons until the climbing properly gets underway!
View the full, interactive route here.

Check out my Fly-Through of the route:
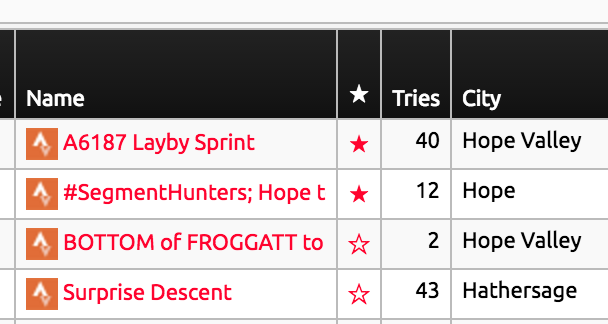 Wherever you see the star next to a segment you can now press it to toggle its starred state. These locations are:


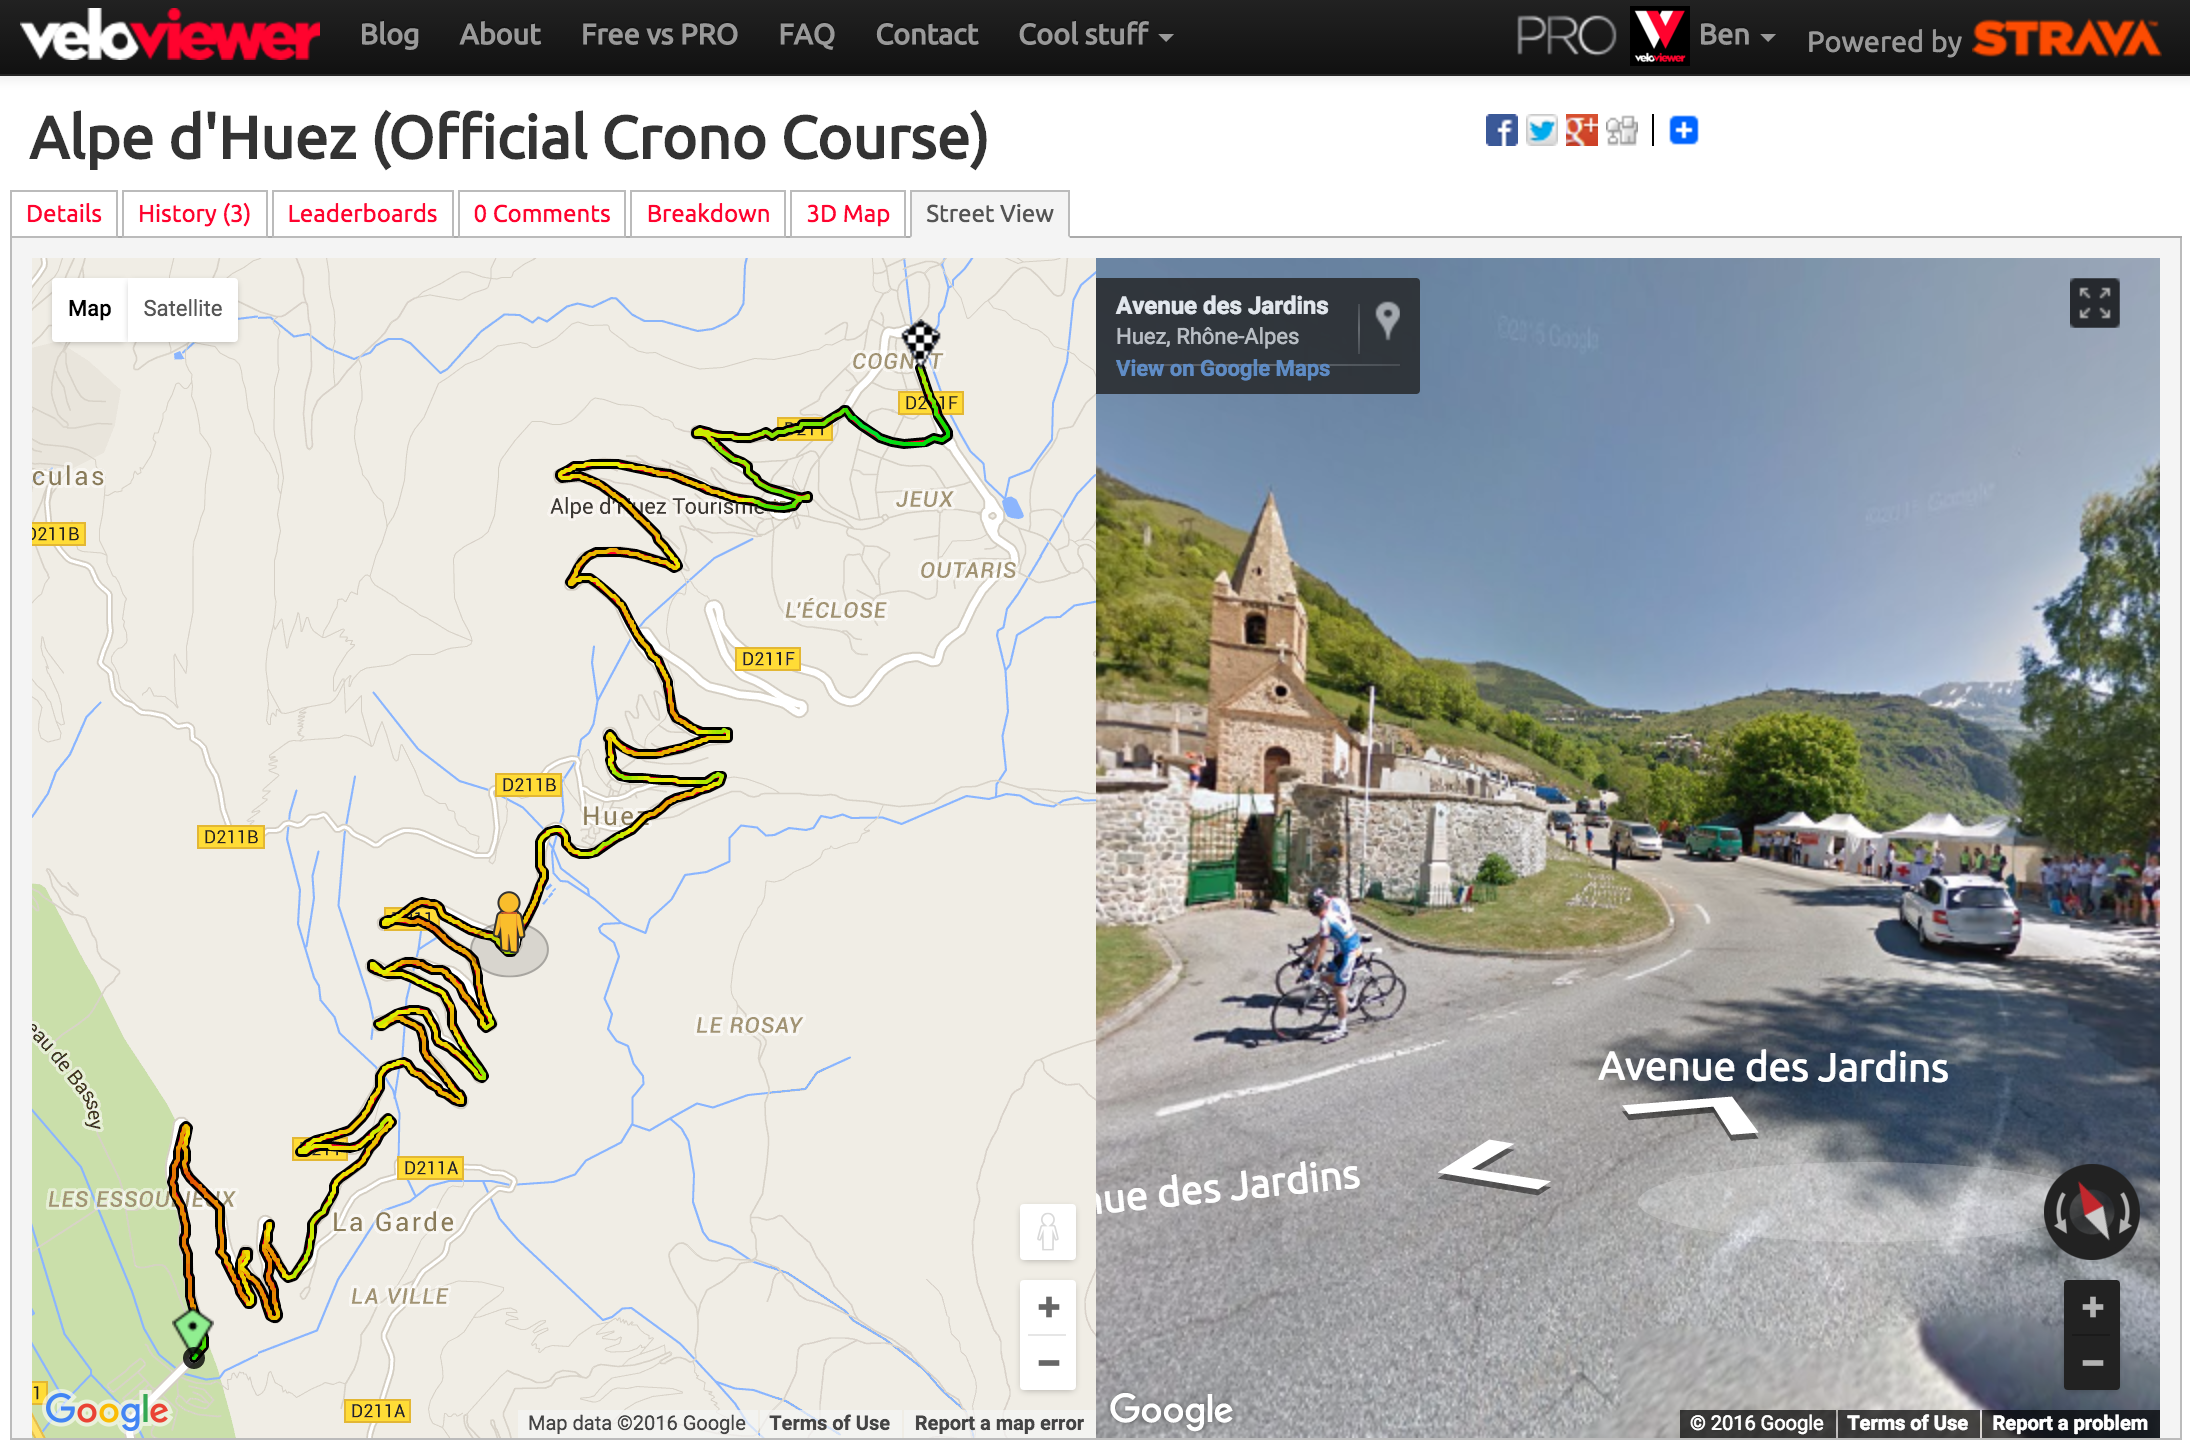 Although we’d all love to be out riding/running much more often, sometimes we’re stuck, looking at a computer, pretending to work. So to make that time as engaging as possible you can now reccy new routes, swot up on all the details of a segment or relive a ride/run from the past using the new/revised Google Street View integration on VeloViewer. Combine that with the new colour gradients shown on the maps and you get a fantastic way to explore the twists, turns, ups and downs.
 The ability to
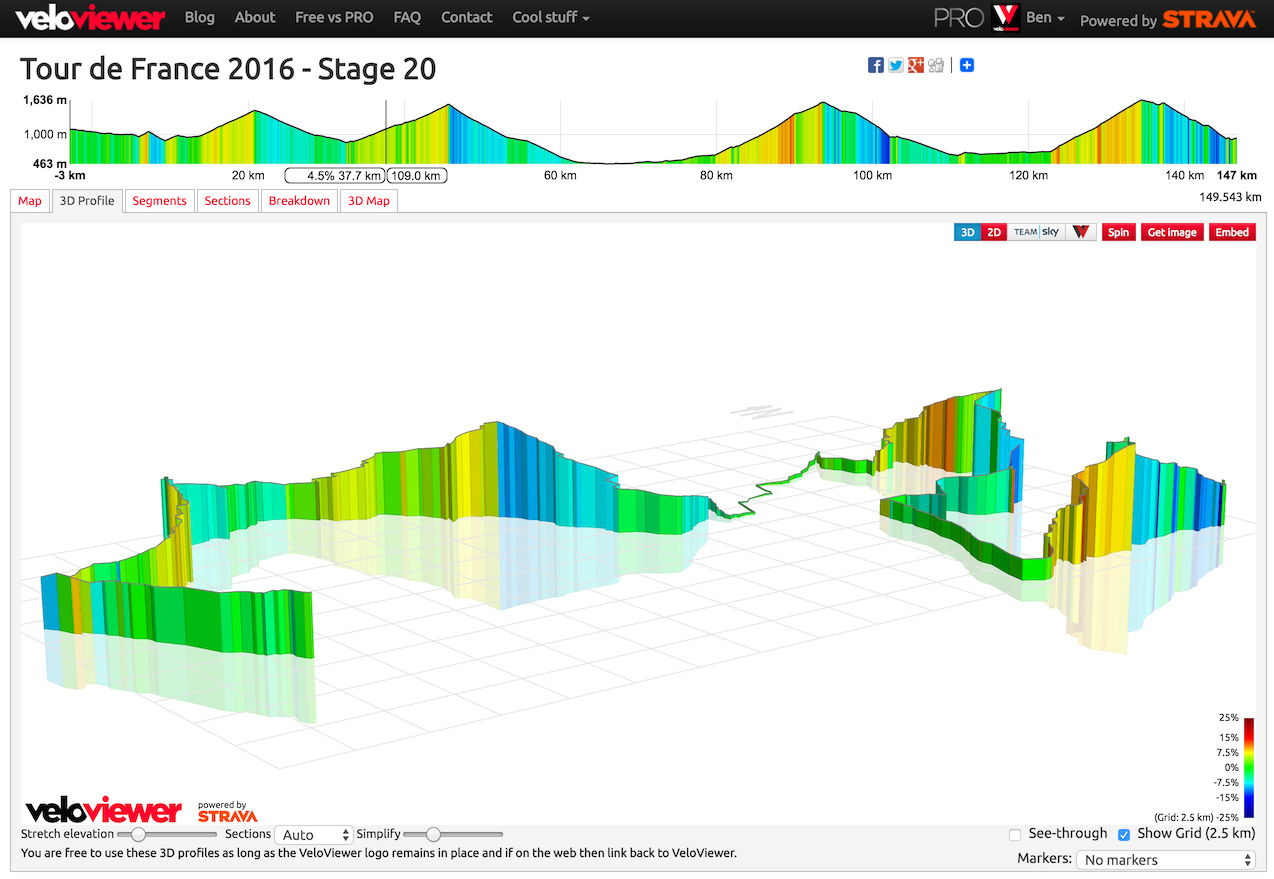
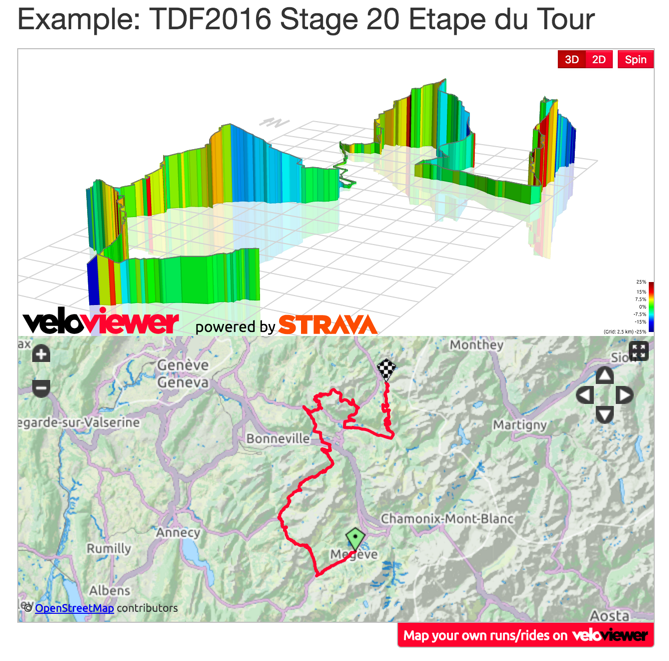
 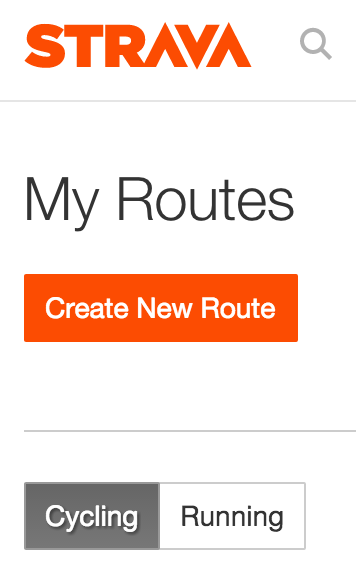 VeloViewer has always been able to show you comprehensive views of your past rides and runs but plenty of people have asked to see similar views of routes they are planning to do. Fortunately Strava have just opened up their Routing API so now I can display all the routes you have created and allow you to see their full details including the interactive 3D profiles.