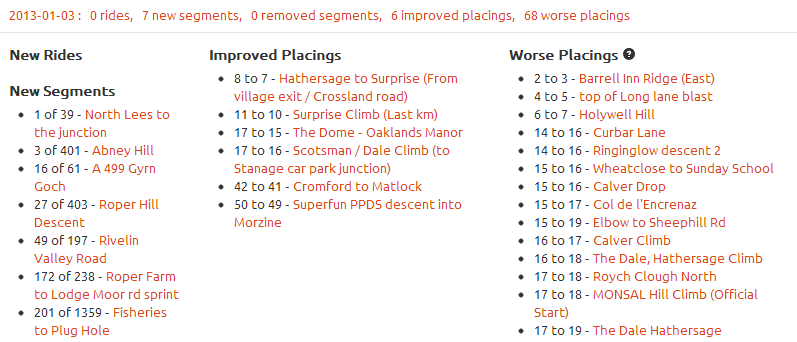
 Yesterday The Sunday Times newspaper (UK) had an article on page 5 of the main section entitled “40mph city cyclists defy speed limits” (in the paper) “City cyclists turn roads into racetracks” (on the website) written by Nicholas Hellen and Georgia Graham which repeatedly refers to a Segment in London where the average speed of the fastest riders is 41 mph. I was contacted by Georgia last Thursday and spoke at length to Nicholas about Strava and how it works and particularly about how you can’t trust the timings (and hence speed) of short segments. But from the beginning of the conversation it was very clear what their angle was going to be and basically wanted me (or someone) to be able to quote saying that Strava encourages me to break the law (speeding (which I pointed out to him isn’t actually breaking the law) and jumping red lights) in built up areas. It doesn’t and I don’t. In this post I’ll do my best to explain why that 41 mph should actually be more like 31 mph.
Author: Ben Lowe
Holme Moss Climb (Tour de France Stage 2, 2014)
 Holme Moss is a bit of a classic around these parts, particularly because it usually requires a fairly long loop and another major climb to get back home again, but also because it is one of the highest roads in the area and at 524m will be the
 highest 2nd highest (Buttertubs Pass is 526m!) point visited by the 2014 Tour de France during its stay in England. Never ridiculously steep, the climb puts its efforts into psyching you out by laying out the snaking finale in front of you with the majority of the climb still remaining. The Mont Ventoux’esque transmitter tower that sits at the summit of the climb is so unmistakably apparent it is impossible ignore what’s in store.
(photo: @paterson_alan)
Full Screen Maps and Panoramio Integration
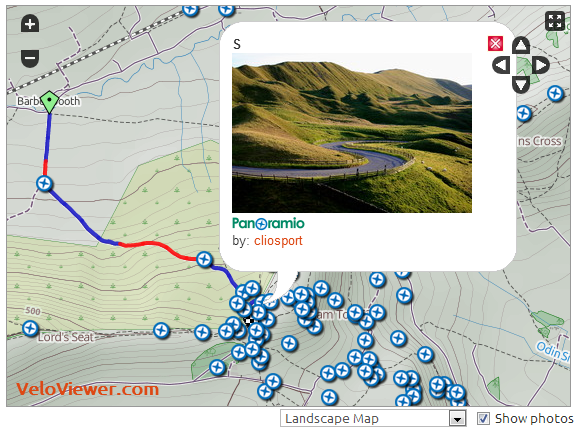 Two very neat additions have been added to the Segment Details and Ride Details‘ maps: the option to go full screen and the option to overlay photos from Panoramio. Now your maps can go HUGE while you review your rides and check out everyone else’s pictures to see what you missed along the route, saves having to stop and take any yourself doesn’t it!
Buttertubs Pass from Hawes (Tour de France Stage 1, 2014)
The Buttertubs Pass from Hawes in North Yorkshire will be one of the first climbs taken in by the 2014 Tour de France in the heart of the Yorkshire Dales National Park. I’m not going to attempt to regale you with tales of my epic ascent of the climb as I can only remember about 25 metres of it (and I don’t think I’ve ever regaled anything very well) so I’ll stick to what I know and provide the cold, hard stats!
Photo: Kreuzschnabel/Wikimedia Commons, License
Top Tips: Making the Most of the Gradient Profile
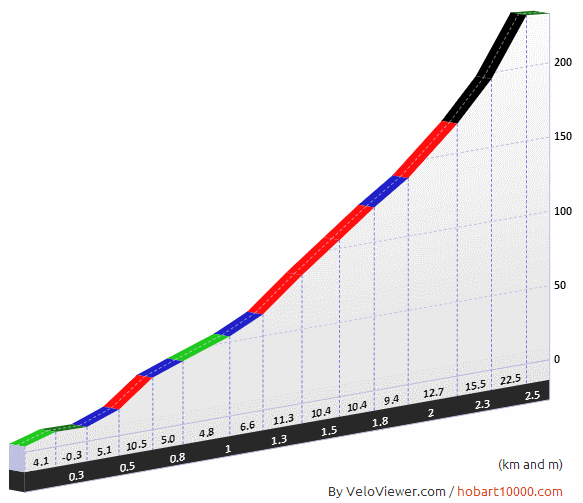 The gradient profile is one of the coolest features on VeloViewer giving your own rides that Pro Tour feel. But did you know that the wider your browser window the more detailed the profile will become?
Thanks must again go to Marc Durdin whose code to provide profiles for the Hobart 10,000 ride was the starting point for what you see now.
Segment on the right is Yorkshire’s Fleet Moss, one of the UK’s 100 Greatest Cycling Climbs and is as painful as it looks. 2014 Tour de France will go past the foot of this climb but unfortunately will be taking the much less dramatic climb to the north of Hawes.
Word/Tag Cloud your Strava Segments
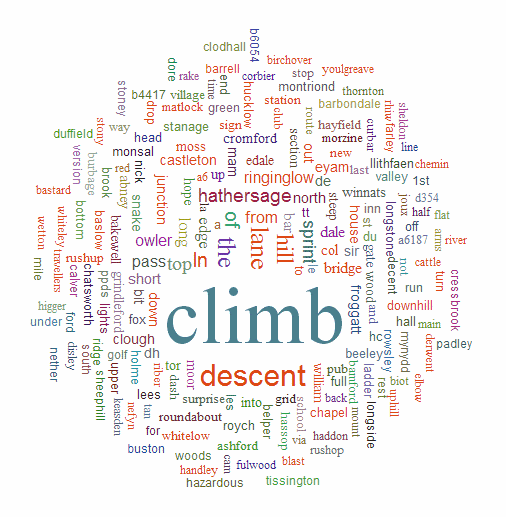 So what type of segments do you tend to ride? OK, this isn’t really going to tell you that perfectly but it might give you some indication. As you can see the segments around here in Sheffield tend to be either climbs or descents, but that’s why I live here! Check out your own Strava segment word cloud on your new Word Cloud page. Update: Now has Ride option too!
Velo Flow: How-To and Secret Features Videos
 Velo Flow allows you to view and interact with animated Strava rides. Getting started with Velo Flow can be a little confusing but the video below walks you through how to do it step by step. The second video shows you some of the hidden features in Velo Flow explaining how to highlight multiple riders and more.
Number of Tries now in Segment List
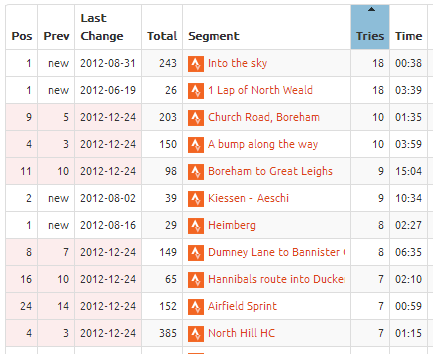 Not quite sure why I didn’t have this column in here from the start to be honest but its there now: the number of tries you’ve had on each segment, and of course you can order by it.
In order to populate the data for this column you must press the “Check for new segments” button on the Update page. Until then you will just see a list of question marks.
You will also see the number of tries in the History tab header on the Segment Details page.
VeloViewer Update Page
Update Ride Dates
 After being pointed out that the Velo Flow link from segments for some rides in Australia weren’t always returning results as expected I discovered I’ve not consistently using the right date from the Strava API. The majority of dates I use have been Greenwich Mean Time which is causing an issue when your ride happened to not be the same day as it was at the time in London.
Easy fix though – once only you will need to press the “Update Ride Details” button on your Update page and then this button will disappear then all your data should be in the appropriate time zones.

