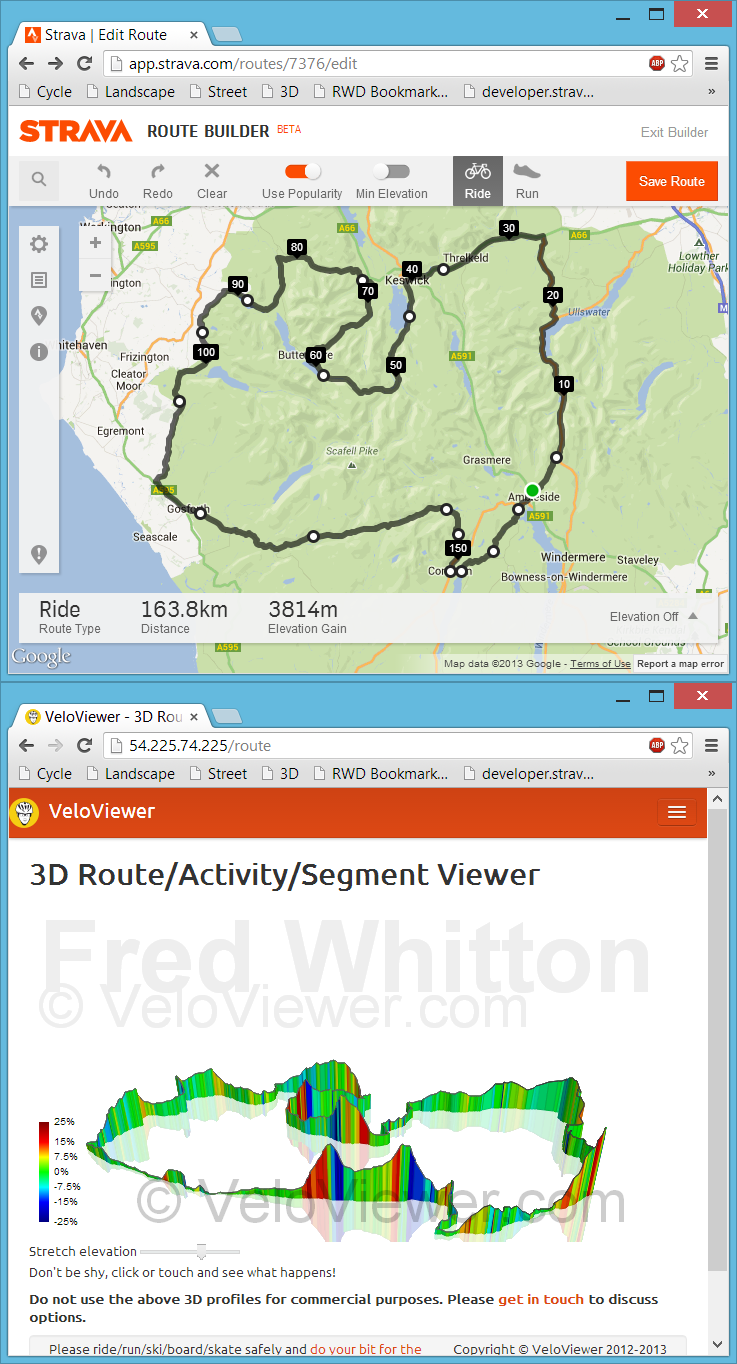
 Back in July I had my first experience with bookmarklets when playing with Marc Durdin’s excellent bit of code that provides his funky elevation profiles for Activities and Segments right there, in amongst Strava’s own page contents. I might have been a bit naive but I just didn’t realise that this thing was so easy to do, so time for a quick play and see what I could come up with. First off I wanted to get an interactive 3D view of the new Strava Routes, the other thing that sprung to mind was to see if I could swap out the Google Maps view for the more detailed (at least here in the UK) Open Street/Cycle Maps which I’ll go into in my next blog post.
Category: Data
What’s coming in Version 3 of VeloViewer
The Strava web services which are the backbone of VeloViewer are set to be replaced in the very near future with a much improved set. These new API’s will open up a huge amount of additional data to what I’ve had to play with previously and I’ll finally know who is actually visiting the site and display or hide data appropriately, First up though is a video I’ve put together of the new Activities page I’ve been working on that shows the new, very interactive cross-filtering functionality integrated with a new activity summary map. Sorry for the very poor narration skills:
Hopefully you’ll understand how these filters will work and how powerful they’ll be for you.
41 mph? The Evidence Against the Sunday Times Article
![]() Yesterday The Sunday Times newspaper (UK) had an article on page 5 of the main section entitled “40mph city cyclists defy speed limits” (in the paper) “City cyclists turn roads into racetracks” (on the website) written by Nicholas Hellen and Georgia Graham which repeatedly refers to a Segment in London where the average speed of the fastest riders is 41 mph. I was contacted by Georgia last Thursday and spoke at length to Nicholas about Strava and how it works and particularly about how you can’t trust the timings (and hence speed) of short segments. But from the beginning of the conversation it was very clear what their angle was going to be and basically wanted me (or someone) to be able to quote saying that Strava encourages me to break the law (speeding (which I pointed out to him isn’t actually breaking the law) and jumping red lights) in built up areas. It doesn’t and I don’t. In this post I’ll do my best to explain why that 41 mph should actually be more like 31 mph.
Yesterday The Sunday Times newspaper (UK) had an article on page 5 of the main section entitled “40mph city cyclists defy speed limits” (in the paper) “City cyclists turn roads into racetracks” (on the website) written by Nicholas Hellen and Georgia Graham which repeatedly refers to a Segment in London where the average speed of the fastest riders is 41 mph. I was contacted by Georgia last Thursday and spoke at length to Nicholas about Strava and how it works and particularly about how you can’t trust the timings (and hence speed) of short segments. But from the beginning of the conversation it was very clear what their angle was going to be and basically wanted me (or someone) to be able to quote saying that Strava encourages me to break the law (speeding (which I pointed out to him isn’t actually breaking the law) and jumping red lights) in built up areas. It doesn’t and I don’t. In this post I’ll do my best to explain why that 41 mph should actually be more like 31 mph.
Holme Moss Climb (Tour de France Stage 2, 2014)
 Holme Moss is a bit of a classic around these parts, particularly because it usually requires a fairly long loop and another major climb to get back home again, but also because it is one of the highest roads in the area and at 524m will be the
 highest 2nd highest (Buttertubs Pass is 526m!) point visited by the 2014 Tour de France during its stay in England. Never ridiculously steep, the climb puts its efforts into psyching you out by laying out the snaking finale in front of you with the majority of the climb still remaining. The Mont Ventoux’esque transmitter tower that sits at the summit of the climb is so unmistakably apparent it is impossible ignore what’s in store.
(photo: @paterson_alan)
Buttertubs Pass from Hawes (Tour de France Stage 1, 2014)

The Buttertubs Pass from Hawes in North Yorkshire will be one of the first climbs taken in by the 2014 Tour de France in the heart of the Yorkshire Dales National Park. I’m not going to attempt to regale you with tales of my epic ascent of the climb as I can only remember about 25 metres of it (and I don’t think I’ve ever regaled anything very well) so I’ll stick to what I know and provide the cold, hard stats!
Photo: Kreuzschnabel/Wikimedia Commons, License
Optimistic Placings Bug Fixed
 Great news! Strava have fixed the bug with their API that resulted in segments with people tied on time returning placings that were better than reality.
This was the main “Known Issue” with VeloViewer and I’ve been completely at the mercy of Strava’s tech team for getting a fix. But it has arrived and with it the most depressing placings update statistics you’re every likely to get! Out of my 804 segments a whopping 486 have resulted in my placing getting worse.
Go update all your placings to get all your correct placings.
Ride Details, the Missing Link
 For a long time the main missing element on VeloViewer has been a ride details page. Well, not any more. Very much a version 1 so expect lots of changes based on some things I still want to add and any feedback/requests you guys want to give me. For now though, view each of your rides’ stats, interactive map, elevation charts (including the gradient histogram – distance travelled at each gradient) and lists of all segments covered (on a secondary tab).
Position Score – the Column Formerly Known as Position Percentile
 Your leaderboard positions on Strava segments can be a bit of a badge of honour but the significance of each of those positions can vary wildly. If you are 6th placed out of 3000 riders then that is pretty good going but 1st place out of just 2 riders is less so. In steps an suggestion from a forum to include a position percentile column and corresponding graphs, a few minutes later and the first incarnation of the position percentile appeared.
Bad Strava Elevation and Distance Data
 Your stats in VeloViewer are only as good as the data that is passed in from Strava, and around 1.5% (based on sample data I had a couple of months ago) of Strava segments seem to have bad data associated with them. The 2 main culprits are dodgy elevation data and non-matching distance data.
This isn’t entirely Strava’s fault although I believe there are ways that they could clear up the majority of these things automatically. But for the time being it is up to us, the Strava community, to tidy it up the best we can which will also result in much more accurate stats in VeloViewer.