 At 293 km the Milan – San Remo is the longest one-day race for the Pro peloton and has one of the most climactic and open finishes of any of the races. With two short (and not actually that steep) climbs in the last 30 km you see all types of rider attempting to make winning moves. Climbers on the way up, the Rouleurs on the way down and the Sprinters in the last 200 m. Which of those will end up being the move of the day will be anyone’s guess. Here we will have a look at those three sections of the route that will decide the race: the climbs of the Cipressa and the Poggio along with the plummeting descent down to the finish in San Remo.
Continue reading
Getting your Power/Heart Rate FTP and Normalised Power from your Strava data
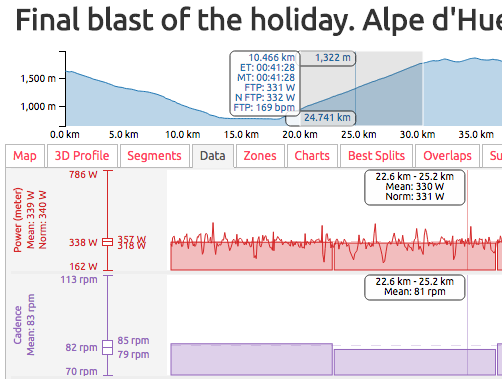 Finding your FTP (Functional Threshold Power/Performance) is a unavoidably painful experience but getting a number out the other end shouldn’t be, which is why I’ve tried to make that part of the process as simple and versatile as possible. Just sync your data from Strava over to VeloViewer and let VeloViewer do all the number crunching on your behalf. Instantly see your power, normalised power and heart rate based FTPs against all your segments or over any part of any of your activities including your best splits.
Continue reading
The Climbs of the 2015 Tour de Yorkshire – guest post by Simon (100 Climbs) Warren
 If you want to get that e-mail in your inbox letting you know that Laurens Ten Damm has stolen your KOM then these are the hills on the 3 stage Tour of Yorkshire you have to bag before May 1st!
Continue reading
Updated Athlete Segment Comparison Page
 The athlete, segment comparison page on VeloViewer used to be limited to just allow you to compare your best efforts against other athletes who used VeloViewer. Well that is no longer the case! The updated version of the comparison page now allows you to compare yourself against any other athlete on Strava on your favourite segments.
 The segment details page is stacked full of stats and charts to show you everything there is to know about the segment
Introducing VeloViewer PRO
Since VeloViewer began a couple of years ago the hosting costs have just about been funded by your very kind donations. As time has passed however, the costs have risen and for the security of my family’s budgeting the time has come to introduce some more structured charging for using the site. From next weekend (8th/9th Nov) a single £9.99 (approx €12.77, US$15.96, AUS$18.34, I’ll soak up any fees) payment will provide you full and continued use of all the VeloViewer goodness for 12 months. A free version will also be available to let people try out the site which will be almost fully functional but only allow you to perform a one-off upload of a limited set of your activities and segments. Hopefully enough to whet the appetite. Anyone who’s donated any amount in the last 12 months will be able to get 12 months PRO access from their donation date.
Tour of Britain 2014 – The Climbs
![]() The World Tour pro peloton returns to the British shores with the 2014 Tour of Britain. The highlight of the year for the domestic professional teams as they get to ride against some of the best in the world. But with some using the race to sharpen their form ahead of the World Champs, the local riders will have their work cut out. The race starts and finishes with city centre criteriums in Liverpool and London but the stages in between contain some classic British climbs. View interactive 3D profiles of all the main climbs below.
The World Tour pro peloton returns to the British shores with the 2014 Tour of Britain. The highlight of the year for the domestic professional teams as they get to ride against some of the best in the world. But with some using the race to sharpen their form ahead of the World Champs, the local riders will have their work cut out. The race starts and finishes with city centre criteriums in Liverpool and London but the stages in between contain some classic British climbs. View interactive 3D profiles of all the main climbs below.
Déjà vu? Finding out if you’ve been there before
 Segments are a great way to see how many times you’ve covered certain sections of road/track, but what if there are no segments set up for the stretch you are interested in? Say hello to the Activity Overlaps tab! OK, probably not the most sexy of names, but what it lacks in title it makes up for in functionality – select any section of any activity and it will search through all your activities and provide a list and map of any that overlap. Neat!
Etape du Tour 2014 (Stage 18) – The Route and Climbs
 Every year thousands of cyclists get to tackle a full stage of le Tour on closed roads as part of l’Etape du Tour. This year’s route takes in two of the most famous climbs of the Pyrenees: Col du Tourmalet and Hautacam. There are even a couple of category 3 climbs thrown into the run-in to help loosen the legs but the route’s full 3D profile shown below puts these into perspective of the two Hors Category ascents still to come. Best of luck to all those riding this year’s Etape, hopefully these graphics will help build the excitement for what’s in store!
Tour de France 2014 Stage 10 – 3D Elevation Climb Profiles
 Stage 10 was thought to be the first major GC battleground but only a short glimpse at the current standings is enough to show that a lot of excitement has already happened in this year’s Tour. Many metres of climbing are already in the legs of riders prior to these first “proper” climbs of the race but with the added appeal of Bastille Day and a rest day tomorrow expect nobody to hold back. With the race still young and the main favourites still unsure of each other’s form then I’m sure we’ll see for offensive tactics rather than defensive often seen near the end of the race. Enjoy!